No lo sé. Offshore quizás? Creo que no pude encontrarla en MY.
Cuenta si la encuentras 
No lo sé. Offshore quizás? Creo que no pude encontrarla en MY.
Cuenta si la encuentras
Pedí que la añadieran en Degiro y me dijeron que no podían porque era un “unit”
Transurban Group operates as a stapled security, which is a structure commonly used in Australia for real estate investment trusts (REITs) and infrastructure companies. In this structure, a unit in the trust is stapled to a share in the company, meaning that investors hold both a share in the company and a unit in the trust as a single security.
Because of this stapled structure, brokers may refer to Transurban as a “unit” rather than a traditional share. This can affect how the security is traded and how dividends are distributed. Some brokers may have specific policies or systems that do not accommodate trading in stapled securities, which could explain why they mentioned that it can’t be made available. If you’re interested in investing in Transurban, you may want to check with a broker that specifically supports trading in stapled securities.
Yo tengo en mi lista Transurban desde hace tiempo, pero cuando se pongan a tiro empresa y bróker. Tenía Australia en broker BBVA, vendí y ya no lo uso como.bróker. Ahora lo compraría en Renta4.
También quiero Sidney airport.
Cuéntanos cuando la viste? A qué precio la esperas? Porque?
Pues la vi hace al menos ocho años! No me acuerdo ya ni al precio que estaba. La última vez que las miré (ahora no hace demasiado.volví a dar una vuelta a las australianas) la vi más cara y RPD no tan buena…me fui a China y compré Yuexiu, más RPD pero bueno, creo que andaba por diez dólares puede ser? De aquellas yo tenía Abertis y la dejé pasar. De todas maneras me sigue interesando el mercado australiano, me llegará el momento de volver a él. Pero luego es un lío también si el dividendo no es fully franked, se pierde mucho en la doble retención, por eso lo tengo ahí en “stand-by”.
Las acciones de WiseTech se desploman tras la dimisión de la mayoría de los miembros de la junta directiva
Los aliados del cofundador Richard White, afectado por el escándalo, toman el control mientras los directores independientes renuncian por “diferencias intratables”
Las acciones de WiseTech perdieron una quinta parte de su valor el lunes después de que la mayoría de su junta directiva, incluido el presidente, renunciaran por “diferencias intratables” relacionadas con el futuro papel del cofundador Richard White, afectado por un escándalo, en la empresa de tecnología que cotiza en bolsa más grande de Australia.
Cuatro de los seis directores del grupo de software logístico, incluido el presidente Richard Dammery, dijeron que renunciarían esta semana debido a “diferentes puntos de vista sobre el papel continuo del fundador”.
Las acciones de la compañía cayeron más del 20 por ciento después del anuncio.
…
El conflicto comenzó con una disputa legal entre White y una exnovia por una factura de muebles impaga, que desencadenó acusaciones de comportamiento inapropiado hacia las mujeres, incluida una empleada. Una denuncia de un exmiembro de la junta directiva sobre un supuesto comportamiento de acoso aumentó aún más la presión…
…
White, que comenzó su carrera reparando guitarras para los miembros de la banda AC/DC en los años 70, cofundó WiseTech para desarrollar sistemas que automatizaran los procesos logísticos, desde el transporte de mercancías hasta los trámites aduaneros. En los últimos años, se ha expandido a nuevos mercados, incluida la tecnología de almacenamiento y carga basada en camiones…
…
Esta es una súper empresa. Tiene riesgo de persona importante parece. Pero no sé cuánto afecta a la empresa en si.
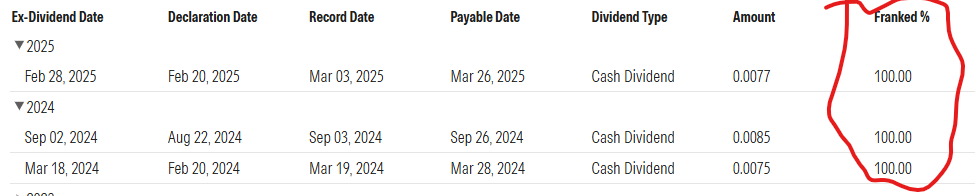
He buscado y leo que las empresas australianas retienen un 30% de dividendo en origen pero aquellas que son franked la eximen totalmente o en parte. Dónde puedo consultar o cómo puedo saber qué tipo de dividendo reparte cada compañía?. Gracias.
Puedes verlo en Morningstar en el histórico de dividendos por ejemplo. O en la página de inversores de la propia empresa lo deberían indicar:
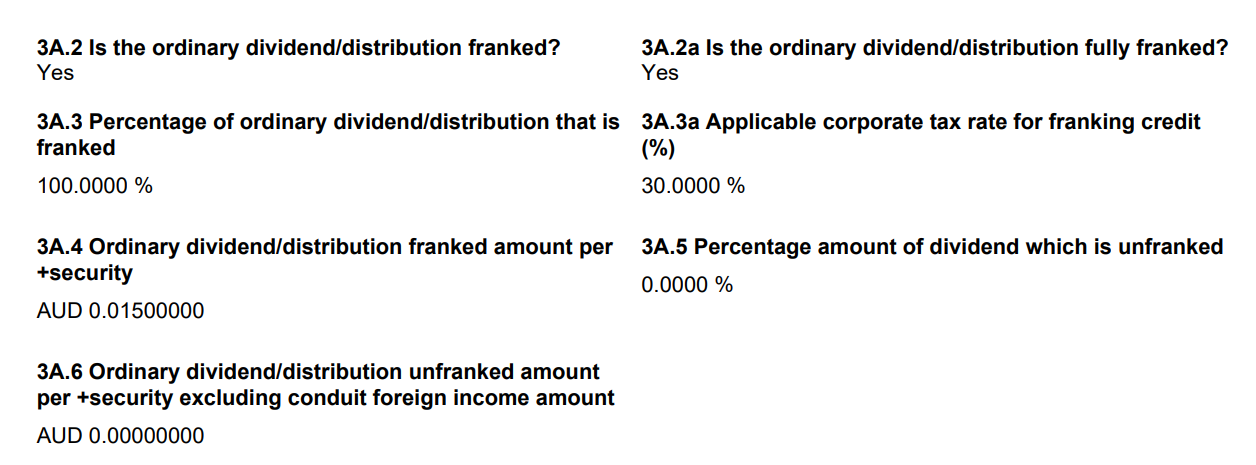
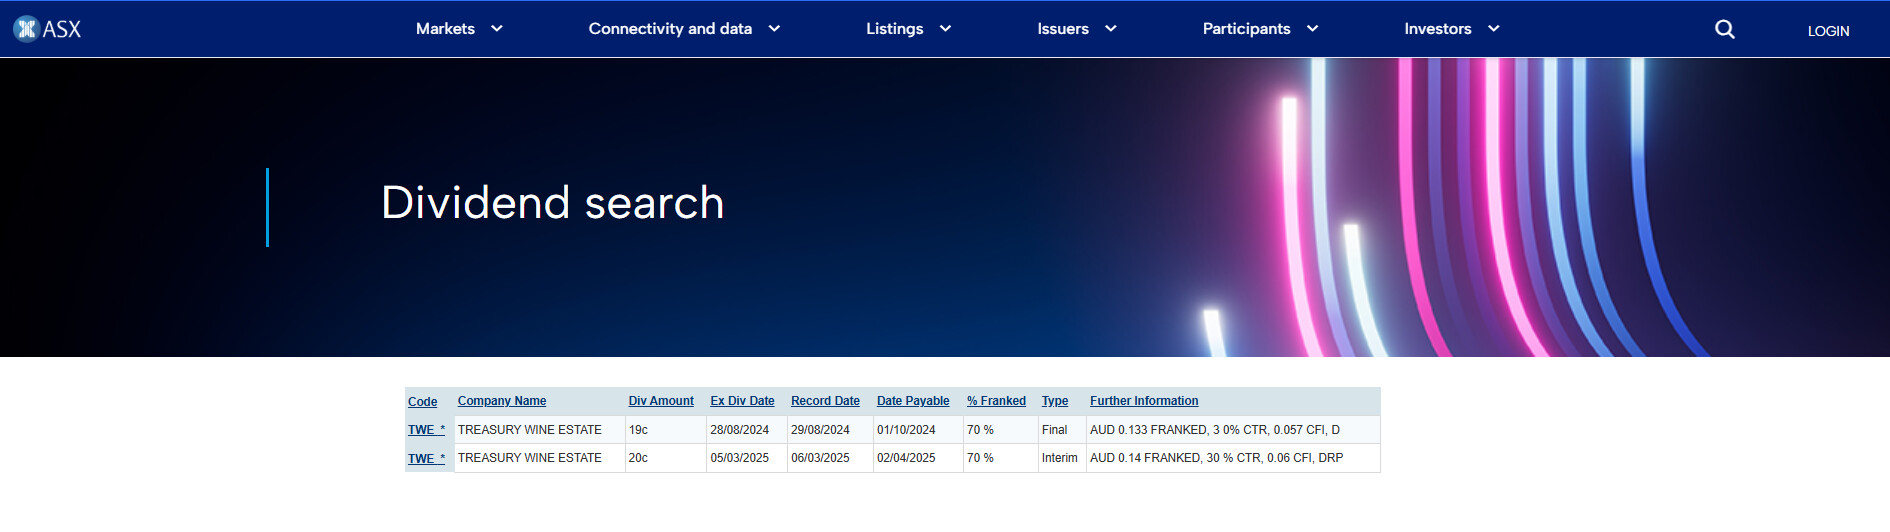
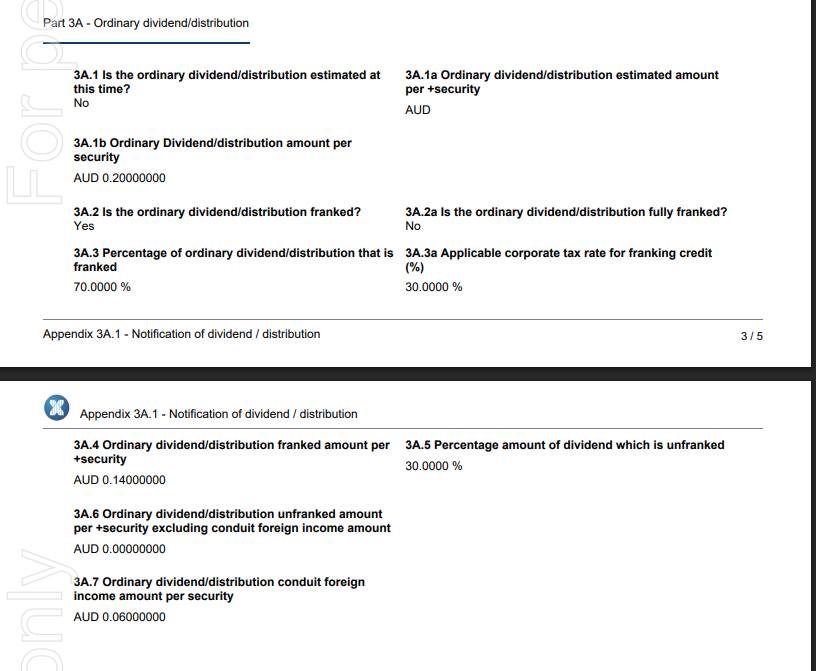
También puedes irte a los anuncios oficiales de cada empresa del ASX, y en el del dividendo suele estar también:
Alguien tiene empresas australianas en Interactive Brokers o Degiro que repartan dividendo non-franked? Estoy intentando averiguar si aplican el 30% genérico de retención a no residentes, o si alguno de los dos brokers getiona (de forma automática o no) la reducción al 15% según tratado.
Gracias
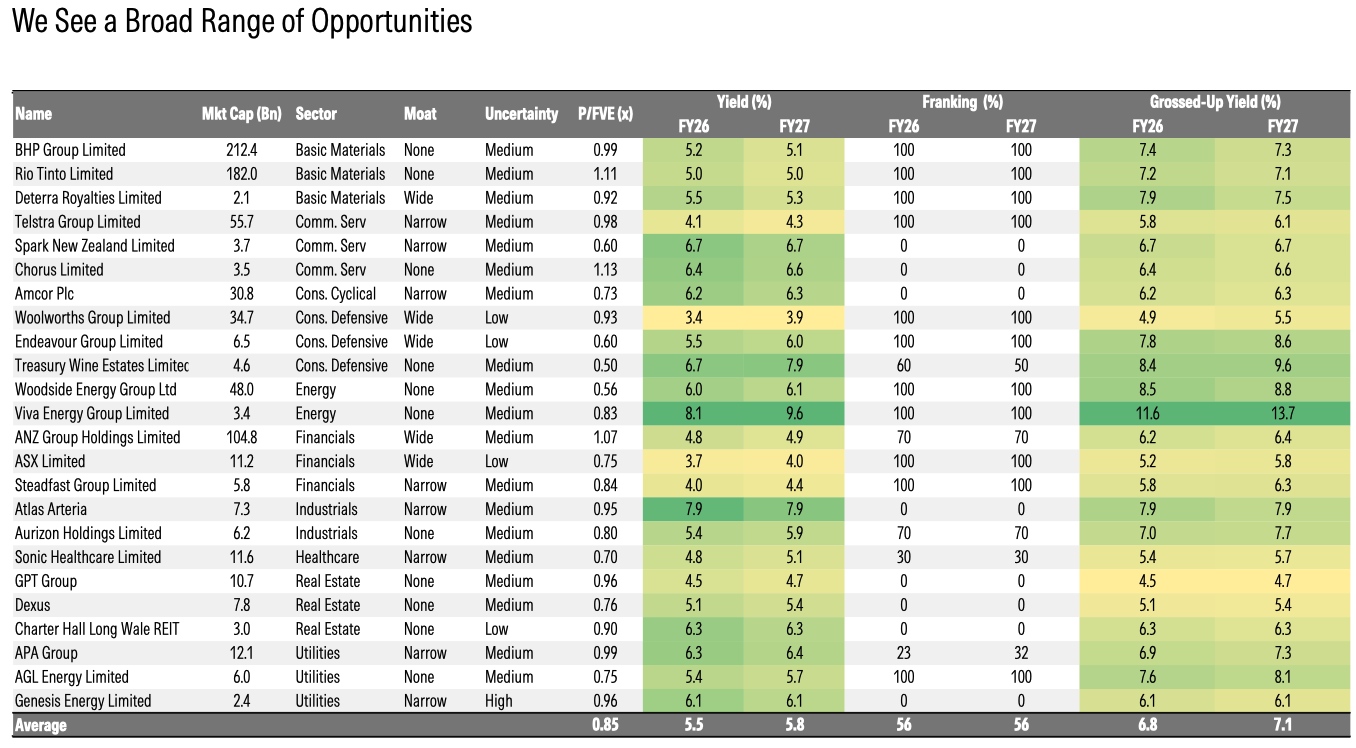
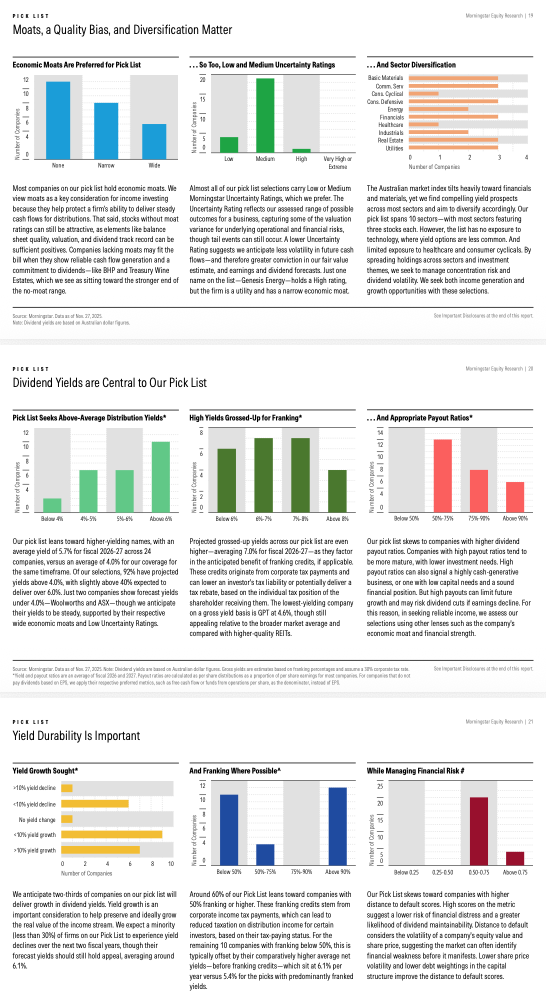
hay un nuevo informe en M*: Perspectiva de dividendos australianos y las mejores selecciones del cuarto trimestre de 2025
Enjoy
WiseTech se esta llevando unos palos importantes..
Quilombos con el dueño y bastante riesgo…
WiseTech Global (ASX: WTC) atraviesa una transición profunda y de alto riesgo para el pequeño inversor, pasando de ser una historia limpia de software de alto crecimiento a un complejo escenario de reestructuración corporativa e integración apalancada. Los resultados del primer semestre del año fiscal 2026 (1H26) reflejan una severa compresión de márgenes debido a la compra de e2open, agravada por una crisis existencial de gobernanza corporativa en torno a su fundador Richard White, que ha provocado el desplome de la cotización a mínimos de varios años el 22 de junio de 2026. Ante este panorama mixto y cauteloso, el foso competitivo de su plataforma CargoWise sigue siendo impenetrable, pero los riesgos financieros y de ejecución obligan a un análisis forense riguroso desde la perspectiva del inversor minorista.
Espejismo del crecimiento e ingresos de baja calidad: Aunque los ingresos totales aumentaron un 76% hasta los 672,0 millones de dólares USD, el 89,2% de ese incremento fue inorgánico por la consolidación de e2open. El crecimiento orgánico real del grupo se desaceleró drásticamente a un modesto 7% (9% para CargoWise), lo que debilita la tesis de crecimiento compuesto puro para el inversor minorista. Además, el crecimiento aportado por los clientes existentes se enfrió significativamente, cayendo de 44,7 millones de dólares USD en el 1H25 a solo 20,3 millones de dólares USD en el 1H26.
Compresión alarmante de beneficios y márgenes: El margen EBITDA reportado del grupo cayó del 50% al 38%, mientras que el beneficio neto estatutario (NPAT) se desplomó un 36% hasta los 68,1 millones de dólares USD, dejando un margen neto estatutario de apenas el 10,1%. Esta caída se debió a costes extraordinarios de reestructuración por valor de 37,5 millones de dólares USD, costes de M&A de 10,8 millones de dólares USD, la costosa amortización de intangibles de e2open y un fuerte incremento de costes financieros netos hasta los 68,3 millones de dólares USD.
Salud financiera degradada a “bono basura”: Para financiar e2open, la empresa contrató una línea de crédito sindicada de 3.000 millones de dólares USD (disponiendo de 2.400 millones), lo que revirtió su histórica posición de caja neta y disparó su ratio de apalancamiento neto estatutario a 3,2x. Con el 82,3% de los activos totales concentrados en intangibles y un patrimonio neto tangible profundamente negativo de -2.241,6 millones de dólares USD, las agencias de crédito han calificado su deuda corporativa como grado especulativo (BB+ / Ba1).
La tesis de inversión se debilita a corto plazo por riesgos de gobernanza asimétricos: El inversor minorista debe asumir que la “prima por fundador” se ha transformado en una penalización corporativa. Las graves acusaciones de la Policía Federal Australiana (AFP) contra el Presidente Ejecutivo Richard White por fraude de visados y explotación sexual destruyeron un 18,44% del valor de la acción en un solo día (cerrando a 30,08 dólares AUD), provocando además dimisiones en el consejo. Esto introduce un descuento permanente por gobernanza que eleva el coste de capital (WACC al 10%-10,5%).
Alertas operativas críticas frente a una sólida retención básica: Aunque CargoWise mantiene una tasa de abandono de clientes inferior al 1% y un alto poder de fijación de precios tras migrar al 95% de sus clientes al modelo transaccional “Value Packs”, la pérdida confirmada del gigante logístico DSV (DB Schenker), que migrará a su plataforma propia “Tango” a partir de 2027, y el plan drástico de despedir al 50% de la plantilla de desarrollo y soporte (~2.000 empleados) amenazan con degradar el servicio y provocar futuros deterioros del fondo de comercio. La conclusión clave para el minorista es mantener la acción bajo estricta revisión o cautela, evitando asignar nuevo capital hasta que baje el apalancamiento y se estabilice el liderazgo independiente.
La dirección ha reafirmado sus previsiones para todo el año fiscal 2026, proyectando unos ingresos de entre 1.390 y 1.440 millones de dólares USD y un EBITDA de entre 550 y 585 millones de dólares USD, lo que implicaría un margen EBITDA anualizado del 40% al 41% y un rango de salida del 43% al 44%. Si bien estas metas parecen alcanzables debido a la rápida ejecución de 50 millones de dólares USD en sinergias de costes de e2open conseguidas de forma anticipada, la sostenibilidad operativa a largo plazo sigue ensombrecida por el caos interno de los despidos y las amenazas personales que ha recibido el consejero delegado Zubin Appoo. A pesar de que la adopción de los “Value Packs” basados en transacciones protege los ingresos frente a la reducción del personal humano de los clientes, las métricas de rentabilidad consolidada (como el ROIC que cayó al 7,8% anualizado) están temporalmente por debajo del coste de capital. Para un inversor minorista con una cartera pequeña, el incuestionable foso defensivo de la plataforma convive ahora con un balance tensionado y una gobernanza rota, haciendo obligatorio exigir un margen de seguridad mucho mayor (con valoraciones intrínsecas ajustadas que oscilan entre los 29,00 y 40,00 dólares AUD por acción) antes de considerar que el valor ofrece una oportunidad de compra clara.
Dejo mi analisis y mi credit score.
WISETECH GLOBAL LIMITED
ASX: WTC | Software & Technology | 22 June 2026
Wide-moat logistics software platform; valuation constrained by integration and founder-governance risk
| RESEARCH STANCE | NEUTRAL / EQUAL-WEIGHT |
|---|---|
| GOVERNANCE-ADJUSTED FAIR VALUE | A$29.00 per share |
| CURRENT PRICE | A$30.08 |
| IMPLIED RETURN TO FAIR VALUE | approximately -4% |
| INDICATIVE VALUATION RANGE | A$24-A$37 |
Investment framing
• CargoWise has exceptionally high customer retention, mission-critical workflows and credible operating-system status within global logistics.
• The e2open acquisition adds strategic scope but also leverage, integration complexity, lower-margin revenue and substantial goodwill.
• At the current price, valuation is broadly balanced: the operating moat is real, but governance and execution discounts remain warranted.
Currency convention
Income-statement and balance-sheet amounts are stated in USD, WiseTech’s reporting currency, unless explicitly identified as AUD. Share-price and per-share valuation figures are stated in AUD.
Independent equity research. This report is not produced by, endorsed by, or affiliated with any investment bank or broker-dealer.
| SECTION | SUBJECT |
|---|---|
| 1 | Executive Summary & Investment Thesis |
| 2 | Company Overview & Core Moat |
| 3 | Financial Analysis & Performance Review |
| 4 | Valuation Methodology |
| 5 | Risk Matrix & Governance Premium Discount |
| 6 | Investment Conclusion |
| Appendix | Sources, methodology and disclosures |
| CENTRAL CONCLUSION WiseTech is a wide-moat operating business but presently only a fairly valued equity. CargoWise quality is offset by e2open integration risk, leverage and a material founder-governance discount. |
|---|
The report uses WiseTech’s FY25 and 1H26 disclosures, publicly available market data as of 22 June 2026, and an independent three-stage DCF. Forecasts and fair value are analyst estimates rather than company guidance except where explicitly stated.
WiseTech has built CargoWise into a credible operating system for global freight forwarding, customs and logistics execution. Its core attributes—less than 1% annual customer attrition for more than 13 years, 99% recurring CargoWise revenue, multi-year enterprise implementations and embedded regulatory content—support a Wide economic moat. [1,2]
The equity proposition is less straightforward. The US$2.3 billion accounting consideration for e2open has transformed WiseTech from a largely self-funded, high-margin software compounder into a leveraged integration story. Reported 1H26 revenue increased 76%, but organic growth was only 7%; reported EBITDA margin fell from approximately 50% to 38%; and statutory net margin fell to 10%. The balance sheet now carries approximately US$2.0 billion of net debt and goodwill equal to 53% of total assets. [1]
Governance is also a first-order valuation input. On 22 June 2026, WTC fell 18.44% to A$30.08 following media reports of a further AFP investigation involving Executive Chair Richard White. Reuters said it could not independently verify the reported claims, while WiseTech and the AFP did not provide substantive comment. The magnitude of the price reaction demonstrates that founder risk is not theoretical: it directly affects the multiple investors are prepared to pay. [6]
Our base-case DCF produces A$28.77 per share, rounded to A$29. Removing the explicit founder/governance risk premium raises fair value to approximately A$36. At the current price, WiseTech is no longer priced for perfection, but there is not yet sufficient margin of safety against governance escalation or e2open execution risk.
| METRIC | CURRENT ASSESSMENT |
|---|---|
| Current stock price | A$30.08 |
| Market capitalization | A$10.10bn |
| Enterprise value | A$12.96bn / US$9.08bn |
| EV/LTM sales | 8.5x |
| EV/FY26E sales | 6.4x |
| Trailing P/E | 43.4x |
| Forward P/E | approximately 22x |
| Net debt/LTM EBITDA | 4.5x |
| Company-defined covenant net leverage | 3.2x |
Source: A$30.08 closing price, approximately 335.8 million diluted shares, RBA spot rate of US$0.7004 per A$1, and 31 December 2025 net debt of US$2.003 billion. LTM figures are calculated as FY25 plus 1H26 less 1H25. Forward P/E is an approximate vendor range rebased to the report-date share price. [1,4,10]
The 4.5x simple leverage ratio uses reported LTM EBITDA. WiseTech’s 3.2x figure is calculated under its banking-covenant methodology and is therefore not directly comparable.
• CargoWise monetization and global rollouts. CargoWise Value Packs, transaction-linked pricing, AI workflow products and Container Transport Optimization could increase revenue per transaction and customer wallet share. Value Packs were live for approximately 95% of CargoWise customers and 59 large global freight-forwarder rollouts were signed or in production after 1H26. [2]
• e2open integration and deleveraging. Successful migration toward a product-led model could materially expand e2open margins and validate the acquisition price. WiseTech achieved its US$50 million annualized e2open cost-synergy target approximately 18 months early; the next tests are subscription retention, margin expansion and net leverage versus the FY27 target of approximately 2.5x. [2]
• AI-led cost restructuring. WiseTech expects AI to shorten development cycles and structurally lower product-development and customer-service costs. Early AI capabilities showed two- to fivefold usage increases, but execution risk is high because approximately 2,000 roles may be removed. Product release velocity, service metrics and capitalized R&D are the critical evidence points. [2]
CargoWise is not simply a freight-management application. It functions as an integrated system of record across international forwarding, customs and regulatory compliance, warehousing and domestic transport, rating, billing and accounting, carrier connectivity, document generation, shipment visibility and workflow automation.
The application supports customers across multiple legal entities, offices, currencies, languages and countries on a common database. WiseTech operates in 193 countries, has customs functionality covering jurisdictions representing approximately 80% of global manufactured trade flows, and connects to more than 400 airlines, 150 ocean carriers and all Class I North American railroads. Following e2open, the broader network encompasses more than 500,000 connected enterprises. [1,2]
• Operational switching costs. Replacing CargoWise requires remapping thousands of workflows, migrating historical shipment and accounting data, rebuilding customs integrations, retraining employees and revalidating external carrier and government connections. A failed migration can interrupt customs clearance, invoicing or cargo movement—an operational risk substantially greater than changing a conventional horizontal SaaS tool.
• Organizational switching costs. Large customers build internal knowledge, automation scripts, standard operating procedures and certification programs around CargoWise. WiseTech reports more than 42,000 CargoWise-certified professionals and over 380 training courses, creating human-capital lock-in in addition to technological lock-in. [2]
• Implementation duration. WiseTech does not publish a single median implementation period. Case evidence points to several months for an individual phase and 12-24 months or more for a major global rollout. Craft began its Brazilian air-freight rollout in August 2022, went live in November 2022 and completed deployment across ten countries by the end of 2023; approximately 90% of its implementation team comprised its own employees. [3]
• Retention evidence. CargoWise application-suite customer attrition has remained below 1% annually for more than 13 years. WiseTech’s definition is conservative: a customer enters attrition after its users have not used the product for at least four months. [1]
This is an independent application of the Morningstar framework, not an official Morningstar rating.
| MOAT SOURCE | ASSESSMENT | EVIDENCE |
|---|---|---|
| Switching costs | Very strong | Less than 1% attrition; mission-critical customs, finance and execution workflows; multi-country implementations; substantial retraining and data-migration costs. |
| Intangible assets | Strong | More than 30 years of logistics-domain knowledge, regulatory content, customs localization, software IP, carrier integrations and certified-user ecosystem. |
| Network effects | Moderate | Carrier, customs, enterprise and trading-partner connectivity increases platform utility and data density. CargoWise is not yet a pure winner-take-all marketplace. |
| Cost advantage | Moderate | A common global code base allows R&D and compliance expenditure to be amortized across customers and countries. The advantage derives from scale rather than low-cost infrastructure alone. |
| Overall rating | Wide moat | Switching costs and domain-specific intangible assets provide a credible expectation of excess returns over a long horizon. |
The moat belongs primarily to CargoWise, not automatically to every acquired product. e2open’s retention, architecture and commercial model must be integrated before the same moat assessment can be applied to the entire group.
WiseTech’s M&A strategy historically had a coherent product logic. It acquired localized customs, compliance and adjacent logistics applications, extracted regulatory knowledge and gradually connected or incorporated functionality into CargoWise. Examples include acquisitions that expanded customs capability in Portugal, Chile, Ecuador, Panama and Colombia, as well as document-management capabilities from BSM Global and ImpexDocs. This approach accelerated country coverage where building regulatory content organically would have taken years. WiseTech had completed 55 acquisitions by 1H26. [2]
The e2open acquisition is qualitatively different: it is platform-scale rather than a conventional tuck-in; expands WiseTech’s customer universe toward manufacturers, shippers, importers, exporters and distributors; introduces a larger professional-services component and a sales-led operating model; was principally debt-funded; and added approximately US$1.384 billion of goodwill and US$885 million of acquired identifiable intangible assets. [1]
e2open contributed US$249.4 million, or 37% of 1H26 group revenue, despite being consolidated for only five months. It also contributed a US$24.2 million statutory net loss during the period. The reported 76% revenue growth in 1H26 therefore overstates the underlying growth rate of the existing business. Organic group revenue growth was 7%, while organic CargoWise growth was 9%. [1]
| ANALYTICAL CONCLUSION WiseTech’s historical acquisition playbook strengthened CargoWise’s product moat. e2open is a much larger capital-allocation test whose success must be measured through retention, integration, margin expansion and returns on invested capital—not revenue consolidation alone. |
|---|
WiseTech’s statutory disclosure refers to e2open and a single consolidated operating segment. It does not disclose a separate “TradeWise” reporting unit; accordingly, this report treats e2open as the relevant acquired platform.
WiseTech changed its functional and presentation currency from AUD to USD during FY25. The change better reflects its global revenue and cost base and aligns reporting with e2open, but it creates comparability issues with older AUD-denominated periods. [4]
• Operating forecasts and DCF. Constructed in USD.
• Equity value. Converted to AUD at US$0.7004 per A$1 as of 22 June 2026.
• FX convention. No long-term AUD appreciation or depreciation is embedded in the base case.
Approximately 29% of 1H26 revenue was invoiced in non-USD currencies, down from approximately 40% in 1H25 following e2open consolidation. WiseTech uses natural and derivative hedges, but translation and transaction exposure remain. [2]
WiseTech remains a single reportable operating segment under accounting standards. The following is therefore a management-product view rather than an IFRS segment presentation.
| REVENUE CATEGORY | US$m | % OF GROUP | GROWTH CHARACTERISTICS |
|---|---|---|---|
| CargoWise | 372.4 | 55.4% | +12% reported; +9% organic; 99% recurring |
| Non-CargoWise legacy platforms | 50.2 | 7.5% | +2% reported; -7% organic |
| e2open | 249.4 | 37.1% | Five months of contribution; predominantly subscription revenue |
| Total revenue | 672.0 | 100.0% | +76% reported; +7% organic |
| REVENUE MODEL | US$m | % OF GROUP |
|---|---|---|
| On-demand recurring licences | 384.3 | 57.2% |
| Subscription and recurring maintenance | 252.6 | 37.6% |
| One-time licences and support services | 35.1 | 5.2% |
| Total recurring revenue | 636.9 | 94.8% |
Source: WiseTech Global 1H26 financial report; analyst calculations. [1]
• Positive. CargoWise recurring revenue remains 99%; customer attrition is exceptionally low; usage-based charging provides natural expansion revenue as customers grow transaction volumes; and Value Packs plus AI features can increase revenue per workflow.
• Less positive. e2open contributed most of the reported growth; organic non-CargoWise revenue declined 7%; transaction-based pricing increases sensitivity to global freight and trade volumes; and professional-services revenue carries lower margins and lower scalability than pure software subscriptions.
| US$m UNLESS STATED | FY25 | 1H26 | FY26 GUIDANCE MIDPOINT |
|---|---|---|---|
| Revenue | 778.7 | 672.0 | 1,415.0 |
| EBITDA | 381.6 | 252.1 | 567.5 |
| EBITDA margin | 49.0% | 37.5% | 40.1% |
| EBIT | 291.3 | 149.6 | -– |
| EBIT margin | 37.4% | 22.3% | -– |
| Statutory NPAT | 200.7 | 68.1 | -– |
| Statutory net margin | 25.8% | 10.1% | -– |
Source: WiseTech Global FY25 annual report and 1H26 results presentation. FY26 guidance midpoint based on revenue guidance of US$1.39-1.44bn and EBITDA guidance of US$550-585m. [2,3]
• e2open mix dilution. e2open generated a reported EBITDA margin of 22%, compared with a 51% organic margin for the legacy WiseTech business. Excluding restructuring, e2open’s margin was 34%. [2]
• Restructuring and transaction costs. 1H26 included US$37.5 million of restructuring costs and US$10.8 million of M&A costs. [1,2]
• Acquired amortization. D&A increased to US$102.5 million, including US$41 million of acquired amortization. [2]
• Interest expense. Net finance costs increased from approximately US$2 million to US$68.3 million because of acquisition debt. [1]
These factors reduced NPAT much more severely than EBITDA. The 10% statutory net margin is not the new normalized margin, but neither is the decline entirely one-off.
| COMPONENT | ASSESSMENT |
|---|---|
| Restructuring and M&A charges | Largely temporary, although additional AI restructuring costs will continue into FY27. |
| e2open’s initial 22% margin | Partly temporary; achieved synergies and operating-model changes should support expansion. |
| Lower e2open gross margin and professional-services mix | Structural unless the revenue mix changes materially. |
| Acquired-intangible amortization | Long-duration accounting headwind. |
| Higher interest expense | Temporary but multi-year, dependent on deleveraging. |
| Greater capitalized R&D | Recurring economic cost, even where excluded from EBITDA. |
A reasonable medium-term outcome is group EBITDA margin recovering into the mid-to-high 40s; e2open margin moving toward the mid-30s or better; statutory net margin recovering more slowly because interest and amortization remain material; and legacy 50-53% group EBITDA margins not being immediately restored. FY27 will be the critical proof year.



Because WiseTech classifies interest paid within financing activities, statutory cash flow from operations is already pre-interest. A useful cash-flow-statement approximation is therefore FCFF approximately equal to statutory CFO less capitalized development and PPE capex.
| METRIC | FY25 | 1H26 / LTM | INTERPRETATION |
|---|---|---|---|
| Statutory ROE | 12.7% | 9.2% LTM | Earnings have not yet kept pace with the enlarged equity base. |
| Annualized 1H26 statutory ROE | -– | 7.7% | Depressed by amortization, integration costs and interest. |
| Annualized 1H26 underlying ROE | -– | 13.0% | Shows better core profitability but excludes real acquisition-related costs. |
| ROIC | 13.4% | approximately 7.8% annualized | The e2open purchase increased invested capital before full earnings realization. |
| Company-reported FCF/EBITDA | 75% | 61% | Pre-tax measure used by management. |
| After-tax FCFF proxy/EBITDA | 57% | 43% | More conservative measure of cash available to all capital providers. |
For FY25, the after-tax FCFF proxy is approximately US$367.0m less US$149.5m, or US$217.5m. For 1H26, it is approximately US$186.1m less US$78.0m, or US$108.1m. The company’s disclosed US$153.6 million 1H26 free cash flow is higher because its operating cash-flow definition excludes US$45.6 million of cash tax. [1,4]
| CAPITAL-EFFICIENCY CONCLUSION The legacy CargoWise economics remain attractive, but consolidated ROIC is temporarily below the estimated 10.5% WACC. Value creation now requires e2open margin expansion, revenue retention and cross-selling, rapid debt reduction and no material impairment of acquired assets. |
|---|
The gap between EBITDA and after-tax FCFF also matters. WiseTech capitalized 48% of 1H26 R&D investment. Investors should therefore avoid treating EBITDA as a complete proxy for economic cash earnings. [2]
• Stage 1: FY27-FY30 — integration and elevated growth. Revenue growth fades from approximately 13.5% in FY27 to 9.5% in FY30. e2open synergies and AI savings lift EBITDA margin from 45% to 49.5%. Capitalized development remains elevated.
• Stage 2: FY31-FY35 — maturation. Revenue growth declines from 8% to approximately 4.5%. EBITDA margin peaks near 50% before fading modestly. Capital intensity normalizes but remains material because global compliance software requires continuous development.
• Stage 3: terminal period. Terminal growth is 3.0%. No further major acquisitions are included. Terminal economics assume WiseTech remains a leading vertical-software platform but does not capture the entire addressable market.
| US$m UNLESS STATED | FY26E | FY27E | FY30E | FY35E |
|---|---|---|---|---|
| Revenue | 1,415 | 1,606 | 2,197 | 2,953 |
| Revenue growth | 81.7% | 13.5% | 9.5% | 4.5% |
| EBITDA margin | 40.1% | 45.0% | 49.5% | 48.5% |
| FCFF | -– | 334 | 609 | 838 |
| FCFF margin | -– | 20.8% | 27.7% | 28.4% |
The FY26 reported growth rate primarily reflects e2open consolidation and should not be extrapolated.
Since forecast cash flows are denominated in USD, the cost of capital uses a USD risk-free rate.

| ASSUMPTION | BASE CASE |
|---|---|
| USD risk-free rate | 4.5% |
| Equity beta | 1.10 |
| Equity risk premium | 5.5% |
| Founder/governance premium G | 1.5% |
| Calculated cost of equity | 12.0% |
| Pre-tax cost of debt | 6.0% |
| Normalized tax rate | 29.0% |
| Target capital structure | 80% equity / 20% debt |
| WACC | 10.5% |
| Terminal growth | 3.0% |
Without the 1.5% governance premium in the cost of equity, the calculated WACC declines to approximately 9.3%.

| DCF COMPONENT | US$m UNLESS STATED |
|---|---|
| Present value of explicit FCFF | 3,542 |
| Present value of terminal value | 4,925 |
| Enterprise value | 8,467 |
| Less FY26E net debt | (1,700) |
| Equity value | 6,767 |
| Diluted shares | 335.8m |
| USD equity value per share | US$20.15 |
| Converted at US$0.7004/A$1 | A$28.77 |
| BASE-CASE FAIR VALUE A$28.77 per share, rounded to A$29. The US$1.7bn FY26E net-debt bridge corresponds approximately to management’s FY26 leverage target of 3.0x applied to midpoint EBITDA guidance. The terminal value represents 58% of enterprise value. |
|---|
| WACC / TERMINAL GROWTH | 2.5% | 3.0% | 3.5% |
|---|---|---|---|
| 9.5% | A$32.6 | A$34.6 | A$36.9 |
| 10.5% | A$27.4 | A$28.8 | A$30.4 |
| 11.5% | A$23.3 | A$24.3 | A$25.5 |
A clean-governance 9.3% WACC produces approximately A$36 per share. The difference of roughly A$7 per share, or 20%, is the estimated governance discount.
The peer set combines global horizontal SaaS, ASX growth SaaS and logistics/supply-chain software. No peer is a perfect match. Xero and Salesforce provide software-model reference points, while Descartes and Manhattan Associates are more directly comparable operationally.
| COMPANY | EV/LTM SALES | EV/LTM EBITDA | FORWARD P/E |
|---|---|---|---|
| WiseTech — current/LTM | 8.5x | 20.6x | approximately 22x |
| WiseTech — FY26E | 6.4x | 16.0x | approximately 22x |
| Salesforce | 3.6x | 12.0x | 10.9x |
| Xero | 5.4x | 35.9x | 64.3x |
| Descartes Systems | 7.5x | 17.6x | 23.5x |
| Manhattan Associates | 7.0x | 26.6x | 24.0x |
| SPS Commerce | 2.4x | 10.2x | 10.9x |
| Peer median | 5.4x | 17.6x | 23.5x |
Source: Approximate point-in-time values; figures may differ by data provider because of EBITDA adjustments, fiscal-year timing and consensus definitions. [9,10]
On LTM figures, WTC trades at 57% EV/sales and 17% EV/EBITDA premiums to the peer median; on FY26 guidance, the comparison improves to an 18% sales premium and a 9% EBITDA discount. A premium remains justified by 99% recurring CargoWise revenue, less than 1% attrition and approximately 51% core margins, but should be smaller given 7% organic growth, e2open dilution, leverage above 4x, goodwill and governance risk. Acquisition amortization and debt distort P/E; EV/EBITDA and after-tax FCFF are better anchors.
| RISK | PROBABILITY | FINANCIAL IMPACT | PRIMARY TRANSMISSION MECHANISM |
|---|---|---|---|
| Founder and governance risk | High | Very high | Higher cost of equity, reduced institutional ownership, management distraction, board instability and multiple compression. |
| e2open integration failure | Medium-high | High | Customer attrition, delayed synergies, weak cross-selling, restructuring costs and lower terminal margins. |
| Leverage and refinancing | Medium | High | Higher interest expense, reduced strategic flexibility and slower capital returns. |
| Goodwill and impairment | Medium | High | Lower reported equity and earnings, evidence of acquisition underperformance and reduced investor confidence. |
| AI restructuring execution | Medium-high | High | Loss of product knowledge, weaker support, delayed releases or service-quality deterioration. |
| Trade-volume and tariff exposure | Medium | Medium-high | Lower transaction volumes partly offset by greater customs and compliance complexity. |
| Cybersecurity and platform resilience | Low-medium | High | Operational disruption, customer losses, regulatory penalties and reputational damage. |
Richard White remains Co-Founder, Executive Chair and Chief Innovation Officer. Zubin Appoo became permanent CEO in July 2025 with operational and performance accountability, while White retained a central role in long-term product strategy. White and RealWise Holdings controlled approximately 35.59% of voting power as of the latest substantial-holder disclosure. [5]
• Alignment benefit. White has substantial economic exposure to long-term value creation and product expertise that is difficult to replace.
• Concentration cost. The shareholding provides significant influence over board and strategic outcomes, while personal or regulatory issues involving White can directly affect the company’s valuation and management capacity.
• February 2025. Four non-executive directors resigned amid differing views regarding White’s role. [7]
• Board review. A subsequent review found that disclosures by White had been inaccurate, incomplete and misleading; White accepted the findings. [7]
• Institutional response. AustralianSuper sold its approximately A$580 million position, citing dissatisfaction with the leadership transition. [7]
• October 2025. AFP and ASIC officers executed a search warrant concerning alleged share trading by White and several employees. WiseTech stated that no charges had been laid and that there were no allegations against the company itself.
• 22 June 2026. The stock fell 18.44% after separate media reports of another AFP investigation involving White. Reuters could not independently verify those reports. [6]
A governance event can affect value through a higher cost of equity, a lower present value of future cash flows, reduced institutional ownership and multiple compression.
We apply a 150-basis-point specific premium to the cost of equity, adding approximately 120 basis points to WACC after capital-structure weighting. This reduces DCF value from approximately A$36 to A$29.
The permanent CEO appointment and board renewal are mitigating factors. They do not fully neutralize the risk while White remains Executive Chair, Chief Innovation Officer and the dominant shareholder.
| BALANCE-SHEET ITEM | US$bn | % OF TOTAL ASSETS |
|---|---|---|
| Goodwill | 2.617 | 53.0% |
| Total intangible assets | 4.062 | 82.3% |
| Total assets | 4.934 | 100.0% |
| Shareholders’ equity | 1.820 | -– |
Source: WiseTech Global 1H26 financial report. [1]
Goodwill equals approximately 144% of shareholders’ equity. The e2open transaction alone created approximately US$2.306 billion of purchase consideration, US$1.384 billion of goodwill and US$885 million of identifiable acquired intangibles. [1]
Goodwill impairment would be non-cash at the point of recognition, but it would signal that expected cash flows, retention or synergies had not materialized. It could materially reduce reported equity and undermine confidence in management’s acquisition discipline. The more important economic risk is that WiseTech may have paid for earnings and customer relationships that fail to generate a return above its cost of capital.
• Can subscription attrition be stabilized?
• Can e2open move from a sales-led to a product-led distribution model without impairing customer relationships?
• Can overlapping technology platforms be rationalized without service disruption?
• Can margins exceed the current 34% restructuring-adjusted level?
• Can WiseTech cross-sell CargoWise capabilities to beneficial cargo owners and e2open functionality to logistics providers?
• Can debt be reduced without underinvesting in product development?
Until these questions are answered, e2open should be valued as an execution-dependent asset rather than automatically receiving the CargoWise quality multiple.
The WTO’s March 2026 outlook projected world merchandise-trade volume growth of approximately 1.9% in 2026, following stronger 2025 growth. Tariff changes and geopolitical developments create a wide range around that estimate. [8]
WiseTech has a two-sided macro exposure.
• Negative volume effect. A decline in container volumes, air-freight shipments, customs entries or freight-forwarding activity reduces usage and transaction-based revenue. The shift from user-based pricing toward transaction-based Value Packs may increase this sensitivity.
• Positive complexity effect. Trade fragmentation, new tariffs, sanctions, documentation requirements and rerouting increase the value of customs-content databases, automated classification, screening and compliance, shipment visibility and cross-border workflow automation.
This creates a partial hedge: lower physical volumes are negative, while greater regulatory complexity can increase software value and customer wallet share. The net impact depends on whether lower transaction volumes outweigh higher compliance intensity. A deep global trade recession remains negative for WiseTech despite the complexity benefit. Management’s FY26 guidance explicitly excludes material deviations in industrial production, international goods flows and geopolitical conditions. [2]
| RATING NEUTRAL / EQUAL-WEIGHT | FAIR VALUE A$29.00 | CURRENT PRICE A$30.08 |
| :---- |
WiseTech presents a clear distinction between business quality and equity attractiveness.
• Wide CargoWise moat.
• Less than 1% customer attrition.
• 99% recurring CargoWise revenue.
• Strong core margins.
• Significant regulatory and workflow IP.
• Long runway among large global freight forwarders and beneficial cargo owners.
• e2open integration remains unproven at scale.
• Net debt is approximately US$2.0 billion.
• Reported ROIC has fallen below the estimated WACC.
• Goodwill represents more than half of assets.
• AI restructuring introduces operational risk.
• Founder-related governance events continue to command a material valuation discount.
At A$30.08, WTC is no longer priced at its former extreme growth multiple. Nevertheless, the A$29 governance-adjusted DCF implies that the current valuation already assumes substantial e2open margin recovery and successful deleveraging.
A sustained re-rating toward the clean-governance value of approximately A$36 would require visible evidence of durable governance separation and stronger independent oversight; e2open EBITDA margins moving above the mid-30s; net leverage approaching 2.5x; CargoWise organic revenue growth returning to the low-to-mid teens; and AI savings being achieved without deterioration in product quality or customer support.
Conversely, guidance reductions, worsening e2open attrition, a material impairment or escalation of regulatory matters would justify a valuation in the lower portion of the A$24-A$37 range.
| FINAL ASSESSMENT Wide-moat company; neutral equity setup; governance and integration remain the decisive variables. |
|---|
[1] WiseTech Global — 1H26 Appendix 4D and Financial Report
[2] WiseTech Global — 1H26 Results Presentation
[3] WiseTech Global — 2025 Annual Report
[4] WiseTech Global — FY25 Appendix 4E and Financial Report
[5] WiseTech Global — Leadership Team
[7] Reuters — WiseTech sinks after directors step down over differing views, 23 February 2025
[8] World Trade Organization — Global Trade Outlook and Statistics, March 2026
[9] StockAnalysis — Salesforce statistics and peer-market reference data
[10] Investing.com — WiseTech Global historical market data
• Valuation date. Market price and market-capitalization inputs are anchored to 22 June 2026.
• Currency. Operating forecasts are in USD; per-share equity value is converted to AUD at the stated report-date spot rate.
• ROIC. Calculated from NOPAT over average invested capital. Acquisition-related amortization and restructuring costs are retained in statutory measures unless explicitly identified as underlying.
• FCFF. A conservative cash-flow-statement proxy is used, deducting capitalized development and PPE capex from statutory CFO.
• Peer multiples. Approximate point-in-time values. Fiscal-year alignment, non-GAAP adjustments and data-provider methodology can create differences.
• Moat rating. Independent framework assessment; not an official Morningstar rating.
This document is an independent analytical report prepared for informational purposes. It is not investment advice, a personal recommendation, an offer to buy or sell securities, or a representation that any forecast will be achieved. The report is not produced by, endorsed by or affiliated with Goldman Sachs, Morgan Stanley, Morningstar, WiseTech Global or any broker-dealer.
Forecasts, valuation assumptions and risk assessments involve judgment and uncertainty. Market prices, exchange rates, consensus estimates, regulatory matters and company guidance can change after the report date. Readers should verify current information and consider their own objectives, risk tolerance and tax circumstances before making investment decisions.
WISETECH GLOBAL
Credit & Solvency Risk Report
Senior Credit Officer-style assessment of WiseTech Global Limited (ASX: WTC)
| HYPOTHETICAL RATING | OUTLOOK | CLASSIFICATION |
|---|---|---|
| BB+ / Ba1 | Stable | Speculative grade |
Financial cut-off: 31 December 2025 | Reporting currency: US dollars
WiseTech retains a strong underlying business franchise, but the debt-funded e2open acquisition has transformed it from a conservatively financed software company into a leveraged acquisition and integration credit. Debt service is currently manageable. It is not yet sufficiently protected against integration underperformance, weaker trade volumes, working-capital leakage or another material acquisition to justify an investment-grade rating.
This is an independent hypothetical assessment based on public information. It is not an official S&P Global Ratings or Moody’s rating and is not investment advice.
WiseTech reported $2.4bn of drawn bank loans, $358.4m of cash, $2.362bn of carrying-value borrowings and $1.820bn of equity at 31 December 2025. Management reported net leverage of 3.2x and $600m of undrawn revolving capacity. Liquidity is adequate, but protection against operating or integration underperformance is only moderate.
| Credit metric | Result | Credit interpretation |
|---|---|---|
| Gross drawn debt | $2,400.0m | Material post-acquisition debt load |
| Net debt | $2,041.6m | High relative to internally generated cash |
| Book debt/equity | 1.30x | Elevated and impairment-sensitive |
| Management net leverage | 3.20x | Covenant/pro forma adjusted basis |
| Annualized reported 1H26 leverage | 4.05x | Conservative; partial consolidation |
| EBIT/gross interest coverage | 2.15x | Weak for investment grade |
| EBITDA/gross interest coverage | 3.62x | Moderate headroom |
| Conservative 1H26 FCFF proxy | $108.1m | Positive, but not abundant |
| Cash after interest and dividends | $21.4m | Thin debt-reduction capacity |
| Cash plus undrawn RCF | $958.4m | Adequate near-term liquidity |
| Goodwill/total assets | 53.0% | High impairment and recovery risk |
| Total intangibles/total assets | 82.3% | Very weak tangible asset protection |
| Net tangible assets | Negative $2,241.6m | Creditors rely on enterprise value |
| Debt-to-Equity = 2,361.6 / 1,820.0 = 1.30x |
|---|
| Net Debt = 2,400.0 - 358.4 = 2,041.6 |
|---|
Using gross drawn debt, debt-to-equity is 1.32x; including lease liabilities, it is approximately 1.33x. Borrowings were only $65.0m at 30 June 2025, so the deterioration is acquisition-related.
| Leverage approach | Calculation | Result |
|---|---|---|
| Management/covenant-style | Reported by WiseTech | 3.20x |
| FY25 pro forma combined EBITDA | $2,041.6m / $578.8m | 3.53x |
| FY26 guided EBITDA, static debt | $2,041.6m / $550m-$585m | 3.49x-3.71x |
| Annualized reported 1H26 EBITDA | $2,041.6m / ($252.1m x 2) | 4.05x |
For rating analysis, a 3.5x-4.0x leverage range is more prudent until the enlarged group demonstrates a full year of cash generation without extensive restructuring or acquisition add-backs.
| Tranche | Drawn/committed | Maturity | Structure |
|---|---|---|---|
| A | $572.5m | July 2027 | Bullet term loan |
| B | $275.0m drawn; $875.0m committed | July 2028 | Revolving facility |
| C | $810.0m | July 2029 | Bullet term loan |
| D | $742.5m | July 2030 | Bullet term loan |
| Total drawn | $2,400.0m | - | - |
The acquisition completed on 4 August 2025 for $2.306bn, including $2.289bn of upfront cash. WiseTech recognized $885.3m of identifiable intangible assets and $1.384bn of goodwill. E2open contributed $249.4m of revenue but a $24.2m statutory net loss during five months of ownership.
| Metric | Pre-transaction/comparative | 31 Dec 2025 / 1H26 | Credit effect |
|---|---|---|---|
| Borrowings | $65.0m | $2,361.6m | Transformational increase |
| Net cash/(debt) | Approx. $102m net cash | $2,041.6m net debt | Sharp reversal |
| Goodwill | $1,235m | $2,617m | More than doubled |
| Total intangible assets | $1,807m | $4,062m | 82.3% of assets |
| Net finance costs | $2.0m | $66.4m | Material debt-service burden |
Before acquisition, e2open LLC carried an S&P issuer credit rating of B. The legacy rating is not transferable to WiseTech, but it demonstrates that the acquired business was a weaker standalone credit.
Management targets leverage of approximately 3.0x by June 2026, 2.5x by June 2027 and below 2.0x by August 2028.
| Implied Covenant EBITDA = 2,041.6 / 3.2 = 638.0 |
|---|
| Required reduction to reach 3.0x at unchanged EBITDA = $127.6m |
|---|
Reported 1H26 cash remaining after tax, capital expenditure, interest and dividends was only about $21m, before financing transaction costs. Near-term deleveraging therefore depends materially on EBITDA growth and integration savings rather than solely on actual debt repayment.
Recurring revenue represented 95% of group revenue, CargoWise recurring revenue was approximately 99%, CargoWise attrition has remained below 1% for more than 13 years, and no customer represented more than 10% of revenue. Usage exposure, trade volumes and e2open professional services prevent the revenue base from being fully fixed.
| Interest Coverage Ratio = EBIT / Interest Expense = 149.6 / 69.7 = 2.15x |
|---|
| EBITDA Interest Coverage = 252.1 / 69.7 = 3.62x |
|---|
| EBITDA / Net Finance Costs = 252.1 / 66.4 = 3.80x |
|---|
| Cash-flow item | 1H26 |
|---|---|
| Company-defined operating cash flow | $231.7m |
| Less cash income tax | ($45.6m) |
| Statutory operating cash flow after tax | $186.1m |
| Less capitalized development | ($74.5m) |
| Less other capital expenditure | ($3.5m) |
| Conservative cash FCFF proxy | $108.1m |
| Less cash interest | ($61.8m) |
| Cash after interest | $46.3m |
| Less cash dividends | ($24.9m) |
| Residual before financing costs/acquisitions | $21.4m |
Annualized solely for sensitivity, cash after interest and dividends is approximately 2.1% of net debt. This is not distressed, but it does not demonstrate rapid organic deleveraging.
Working capital consumed $59.2m in 1H26 versus $5.0m in 1H25. Customer receipts of $648.3m were approximately 96.5% of revenue.
| Indicative DSO = 40.9 days | DPO = 42.3 days | CCC = -1.4 days |
| :—: |
The mechanical CCC is distorted because the opening balance sheet excludes e2open and the closing balance sheet includes it. The relevant warning signs are the working-capital outflow, receivables growth and any erosion of deferred-revenue funding.
| Goodwill / Total Assets = 53.0% |
|---|
| Total Intangibles / Total Assets = 82.3% |
|---|
| Goodwill / Equity = 143.8% |
|---|
WiseTech disclosed negative net tangible assets of $2.242bn. This is not evidence of immediate insolvency, but it means senior unsecured recovery depends heavily on preserving the business as a going concern.
The e2open transaction generated $1.384bn of goodwill. Principal impairment triggers include subscription attrition, failure to realize synergies, integration disruption, lower sustainable margins, higher discount rates, lower terminal growth and higher-than-expected development spending.
| Goodwill impairment | Charge | Pro forma equity | Book debt/equity |
|---|---|---|---|
| 0% | - | $1,820.0m | 1.30x |
| 10% | $261.7m | $1,558.3m | 1.52x |
| 25% | $654.3m | $1,165.7m | 2.03x |
| 50% | $1,308.7m | $511.4m | 4.62x |
A goodwill impairment is normally non-cash and should not directly breach the disclosed leverage or coverage covenants if excluded from adjusted EBITDA. The indirect risk is that impairment normally follows lower forecast EBITDA, which directly weakens both covenants and refinancing confidence.
Near-term default probability appears low, but the post-acquisition balance sheet does not provide an investment-grade margin of safety. Strengths include recurring revenue, mission-critical software, diversification, positive cash flow and adequate liquidity. Constraints include leverage, modest coverage, bullet maturities, negative tangible equity, integration risk and an acquisitive financial policy.
| Covenant | Contractual requirement |
|---|---|
| Interest coverage | Adjusted EBITDA / net interest expense >= 3.00x |
| Leverage through 30 June 2026 | Net debt / adjusted EBITDA <= 4.00x |
| Leverage: July 2026-June 2027 | <= 3.50x |
| Leverage from July 2027 | <= 3.00x |
WiseTech stated that it was compliant at 31 December 2025.
| EBITDA stress | Net leverage | Interest coverage proxy | Interpretation |
|---|---|---|---|
| Base | 3.20x | 3.80x | Compliant |
| 10% decline | 3.56x | 3.42x | Above post-June 2026 leverage limit |
| 20% decline | 4.00x | 3.04x | At current covenant boundaries |
| 25% decline | 4.27x | 2.85x | Breach absent mitigating actions |
| Metric | Acceptable | Warning | Downgrade concern |
|---|---|---|---|
| Net leverage | <=3.0x FY26; <=2.5x FY27 | >3.25x after June 2026 | >=3.5x/amendment |
| EBITDA/net interest | >=4.0x | <3.5x | <=3.0x |
| EBIT/gross interest | >=2.5x | 2.0x-2.5x | <2.0x |
| Post-interest FCF/net debt | >=5% | 3%-5% | <3% |
| Liquidity/24-month uses | >=1.5x | 1.2x-1.5x | <1.2x |
| Cash conversion | WC neutral/positive | Repeated outflow | Structural consumption |
| Acquisition policy | Small, internally funded | Material pre-deleveraging | Transformative debt-funded |
WiseTech’s probability of near-term default appears low, supported by recurring revenue, positive cash flow and adequate liquidity. However, its margin of safety is no longer investment-grade quality.
| High acquisition debt + adjusted EBITDA reliance + bullet maturities + negative tangible equity |
|---|
WiseTech can earn its way back to investment grade, but it must demonstrate that e2open produces durable cash EBITDA, working-capital normalization does not absorb expected synergies, and management prioritizes debt reduction over further transformative acquisitions.
FINAL HYPOTHETICAL RATING: BB+ / Ba1, Stable - speculative grade.