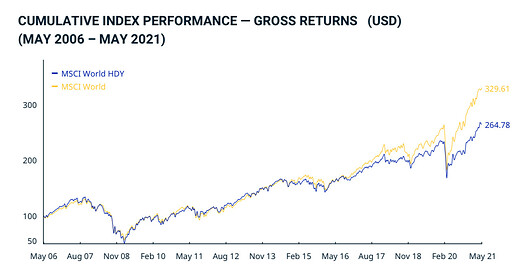
¿Qué te parece este?
https://www.msci.com/documents/10199/74fe7e16-759e-405c-96aa-8350623fae65
Supongo que el MSCI World High Dividend Yield Index podría ser un índice más apropiado para los que invertís con el principal objetivo de generar rentas.
En todo caso, en los últimos años lo ha hecho peor que el MSCI World normal y corriente.
Pongo por aquí las primeras 50 posiciones del MSCI World High Dividend Yield Index sacadas del enlace que puse el 16 de mayo:
| JOHNSON & JOHNSON | 3.918637% |
|---|---|
| PROCTER & GAMBLE CO | 2.879441% |
| NESTLE | 2.855689% |
| INTEL CORP | 2.407542% |
| ROCHE HOLDING GENUSS | 2.157136% |
| VERIZON COMMUNICATIONS | 2.140355% |
| COCA COLA (THE) | 1.903368% |
| AT&T | 1.870195% |
| CISCO SYSTEMS | 1.812887% |
| NOVARTIS | 1.809404% |
| ABBVIE | 1.788216% |
| PFIZER | 1.749604% |
| MERCK & CO | 1.710938% |
| PEPSICO | 1.686527% |
| TEXAS INSTRUMENTS | 1.523768% |
| TOYOTA MOTOR CORP | 1.472578% |
| BRISTOL-MYERS SQUIBB CO | 1.301194% |
| UNILEVER PLC (GB) | 1.292179% |
| PHILIP MORRIS INTL | 1.236031% |
| AMGEN | 1.234925% |
| SIEMENS | 1.127367% |
| TOTAL | 1.102135% |
| UNITED PARCEL SERVICE B | 1.078993% |
| RAYTHEON TECHNOLOGIES | 1.055129% |
| IBM CORP | 1.005185% |
| SANOFI | 0.974975% |
| 3M CO | 0.950724% |
| ALLIANZ | 0.942394% |
| RIO TINTO PLC (GB) | 0.921028% |
| CVS HEALTH | 0.847243% |
| LOCKHEED MARTIN CORP | 0.784533% |
| GLAXOSMITHKLINE | 0.784457% |
| ALTRIA GROUP | 0.773363% |
| BRITISH AMERICAN TOBACCO | 0.760804% |
| SCHNEIDER ELECTRIC | 0.755195% |
| TRUIST FINANCIAL CORP | 0.740744% |
| GILEAD SCIENCES | 0.731519% |
| IBERDROLA | 0.716860% |
| BASF | 0.714521% |
| CME GROUP | 0.703343% |
| PNC FINL SERVICES GROUP | 0.685126% |
| DUKE ENERGY CORP | 0.598496% |
| TOKYO ELECTRON | 0.581734% |
| ZURICH INSURANCE GROUP | 0.579136% |
| BAYER | 0.578979% |
| RECKITT BENCKISER GROUP | 0.559758% |
| DOMINION ENERGY | 0.533024% |
| ABB LTD | 0.504882% |
| EATON CORP PLC | 0.499929% |
| EMERSON ELECTRIC CO | 0.494160% |
Estos son los criterios utilizados para crear este índice:
The MSCI World High Dividend Yield Index is based on the MSCI World Index, its parent index, and includes large and mid cap stocks across 23 Developed Markets (DM) countries*. The index is designed to reflect the performance of equities in the parent index (excluding REITs) with higher dividend income and quality characteristics than average dividend yields that are both sustainable and persistent. The index also applies quality screens and reviews 12-month past performance to omit stocks with potentially deteriorating fundamentals that could force them to cut or reduce dividends.
