46 años aumentando el dividendo bien merecen un hilo. Dejo la presentación a Dividend Diplomats:
Leggett & Platt, Inc.: A Dividend Stock To Help You Sleep At Night
Summary
Leggett & Platt, Inc. has been around for over 135 years and endured through all financial and economic cycles.
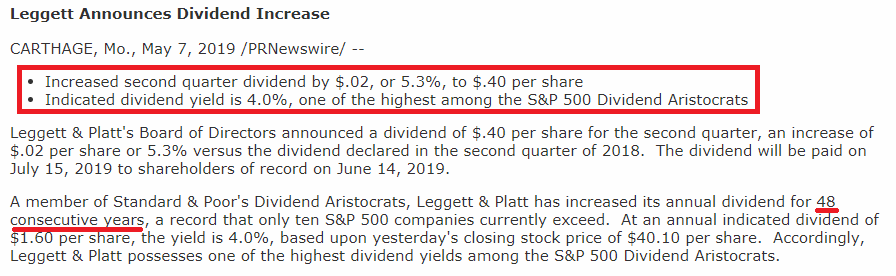
Leggett & Platt, Inc. is a dividend aristocrat, increasing their dividend for 48+ consecutive years.
Leggett & Platt, Inc. produces many parts used across the world in bedding and automobile. They are involved in two critical components of everyday life - sleeping and driving.
Leggett & Platt, Inc. History and Background
If you ever catch yourself sleeping on a bed or walking out in the morning to hop in your car on your daily commute, there is a chance the same company was involved in both of them. That company is Leggett & Platt, Inc. (LEG). They have been around since 1883, formed by two gentlemen, and ended up being a massive company.
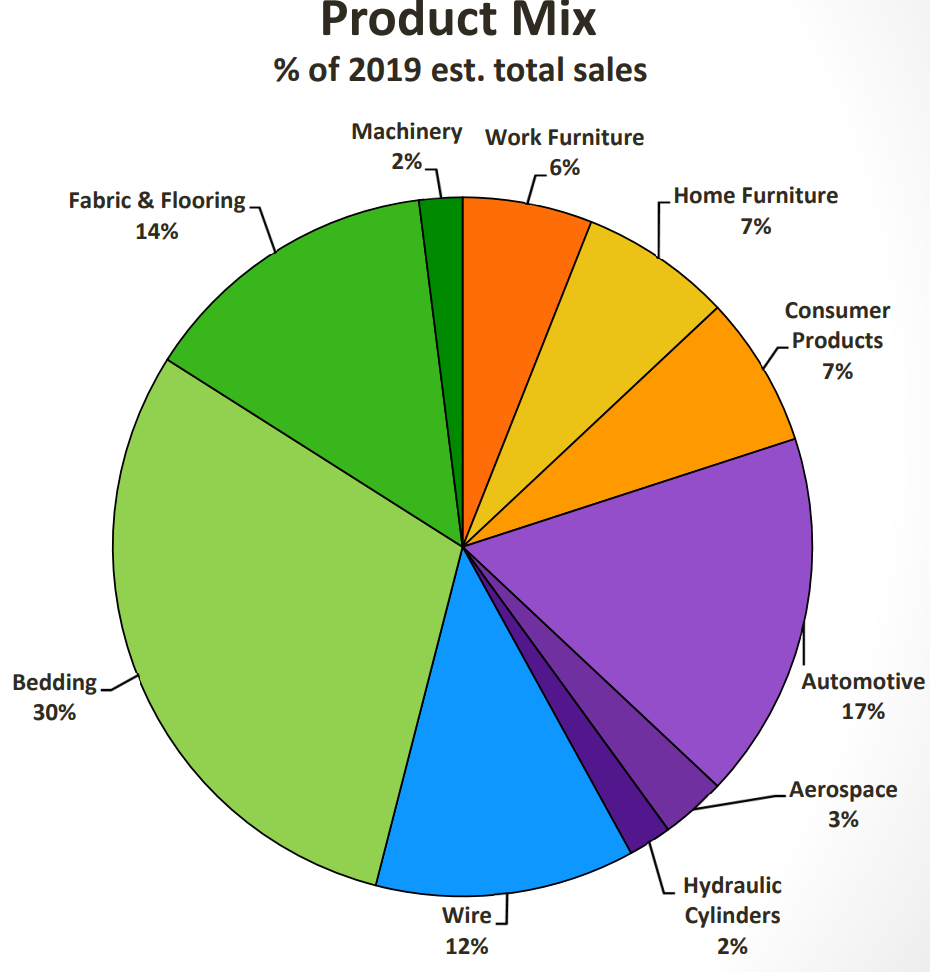
For more background on LEG, here is information from their investor relations page, “Leggett & Platt is the leading U.S.-based manufacturer of: a) components for bedding; b) automotive seat support and lumbar systems; c) specialty bedding foams and private-label compressed mattresses; d) components for home furniture and work furniture; e) flooring underlayment; f) adjustable beds; g) high-carbon drawn steel wire; and h) bedding industry machinery.” As you can see, they have their hands in quite a bit of product that is used in everyday life.
When it comes to a dividend investment, these are the companies I love to research and review. LEG has their hand in a product that is used by millions, if not billions, every single day. We all sleep - most of us in a bed. Millions of us drive to work, see friends, family, take road trips, etc. LEG has produced parts in both areas of life and those two segments represent the two largest components of their revenue, as you can see from their investor presentation page below:
Having such a rich and entrenching history, it was a no-brainer for me to see if I should add more of this dividend aristocrat to my portfolio. This is especially because the S&P 500 is up almost 14% year-to-date (through May 17, 2019).
Therefore, I want to look at LEG’s financial performance through first quarter 2019 and look at their revenue, profitability and balance sheet from a liquidity standpoint. I want to see if they can satisfy current debt obligations, see how their debt levels are trending (i.e., if they are struggling to turn sales, collect receivables, etc.), and if their operating cash flow is sufficient for their business.
The operating cash flow is critical, as that is what is supporting their historical dividend pattern. They are one of the dividend aristocrats (a dividend aristocrat is a company with 25+ consecutive years of dividend increases) and are approaching another legendary status. That legendary status is 50 consecutive years of dividend increases, and they are only two years away. Therefore, I want to see if their operating cash flow and financial performance is sufficient to sustain current and future dividend payments. By running the metrics through the Dividend Diplomat Stock Screener, that will help determine the conclusion for that requirement.
Financial Performance of Leggett & Platt, Inc.
| Ticker | Revenue* | Net Income* | Current Assets | Inventory | Current Liab. | LT Debt | Current Ratio | Quick Ratio |
|---|---|---|---|---|---|---|---|---|
| LEG | $1,155 | $61.20 | $1,659 | $676.80 | $867 | $2,409.60 | 1.91 | 1.13 |
*Figures from Q1 2019
First quarter earnings were published a few weeks ago, link here. Given that 2018 was an incredible year, from an earnings standpoint (due to TCJA), I am curious on how LEG will be performing post-tax cuts.
Revenue of $1.16 billion, noted above, was actually 12% higher than the first-quarter revenue of 2018. What caused the increase? Was it more demand? Higher priced goods being sold? Well, the increase was primarily the result of an acquisition. LEG acquired Elite Comfort Solutions, or “ECS”. ECS had proprietary foam technology for bedding/mattresses, to which, LEG financed the operation with $500 million of debt and other cash considerations (total of $1.25 billion).
Net Income, however, at $61.20 million in Q1 was lower than last year’s Q1 net income of $77.9 million. This is in part due to an increase in selling costs of $14 million, $9.1 million higher amortization of intangibles and a $2.7 million charge to impairment expense on the furniture segment. The amortization is high due to the expensing over a 5-year life of the non-compete agreements & customer list intangible from acquisition post Q1 2018, such as ECS.
Therefore, revenue & sales are trending in the right direction, but the non-cash costs of amortization and impairments dragged earnings down for the quarter. Since the ECS acquisition has closed and debt was issued, time to look at the balance sheet.
From the chart above, their current ratio is close to 2.00, which is incredible. This shows they can pay their current liabilities 2x over, almost. Their 1.91 ratio is higher than the 1.87 ratio at 12/31/2018. Taking inventory into consideration, to calculate the quick ratio, LEG’s ratio of 1.13 is still amazing. Comparing to 12/31/2018, this quarter had an increase in the ratio by 0.04, which is better. However, the acquisition added long-term debt costs, $500 million alone per their announcement of acquiring ECS. Therefore, I would expect this to increase.
Sadly, the long-term debt more than doubled from $1.167 billion to $2.4 billion. $1.1 billion of this debt is due in 3+ years, with more due in the 3-5 year time frame ($600 million). Therefore, they have quite a bit of work to do to knock this debt out. Their operating cash flow shrunk from a year ago, primarily due to the change of accounts payable/accrued expenses, and the concern is how they’ll be able to pay down debt and invest while paying out dividends. This looks like a great time for the dividend analysis.
Leggett & Platt, Inc. Dividend Analysis
| Ticker | Stock Price* | Dividend | Forward EPS** | Dividend Yield | Payout Ratio | 3-Year Growth Rate | 5-Year Growth Rate | P/E Ratio |
|---|---|---|---|---|---|---|---|---|
| LEG | $37.53 | $1.60 | $2.47 | 4.26% | 64.78% | 5.56% | 5.03% | 15.19 |
*As of 5/17/2019
**Taken from Yahoo! Finance
I would want to see a payout ratio below 60%, a price to earnings (P/E) ratio below 18, a yield above 3% and a dividend growth rate at 7%. Though, if the yield is over 4%, a dividend growth rate of 6% is acceptable. The figures used in the analysis will be from May 17, 2019.
1.) Payout Ratio - Taking the dividend and dividing by the analyst expectations of $2.47 of earnings for the year equates to a ratio of 64.78%. This is above the acceptable range of 60% and does show a slight sign of concern for LEG. Typically, especially in the situation of adding debt, I’d like to see a lower payout ratio. This fell just above and would need monitoring.
2.) Price to Earnings (P/E) - Here we go now! This metric is used to see if the company is undervalued. According to my source, the S&P 500 P/E ratio is 21.60. Therefore, LEG’s 15.19 ratio is below that and below the 18 mark that I typically like to set. This demonstrates that their stock is slightly undervalued, which could be due to the debt load they have now.
3.) Dividend Yield - The current dividend of $1.60 per year is generating a 4.26% yield. This is above the S&P 500 average dividend yield, as well as above the 3% yield for my baseline in my expectation. For every $1,000 invested into LEG, one can expect $42.60 in dividends going forward, before considering dividend increases. Speaking of which…
4.) Dividend Growth Rate - LEG is a dividend aristocrat with 48 consecutive years of growing their dividend. They even tout this message on their investor page. The most recent increase was from $0.38 to $0.40 or 5.26%. The 3-year growth rate average is 5.56% and 5-year average is 5.03%. 5.56% + 4.26% is 9.82% and would be acceptable to me.
Overall, the metrics show positives and a few cons. One, I believe the payout ratio is high for this type of company, which produces physical goods for industries. I would like to see that in the 40-50% range, as opposed to higher than 60%. Further, their dividend growth rate may be slowing, with the payout ratio rising. We may be seeing 2 cent increases per share for the next few years going forward (i.e. 3-5 years), which would equate to lower dividend growth rates. However, their price to earnings is low and their dividend yield is high and is over a full percentage point above their 5-year dividend yield average.
Conclusion
Now that we have taken the time to review LEG’s Q1 performance, their balance sheet and dividend metrics, we have enough to make a decision on whether or not to add to my position in LEG.
First, I love their history and that they have gone through every economic cycle imaginable. They are in every aspect of a typical person’s life, with sleeping and driving. Further, they saw a chance to bolster their foothold in the marketplace with the ECS acquisition and have further proprietary over the bedding industry.
Second, due to the acquisitions and actions to become a better company, they have more intangible assets on their balance sheet, as well as additional debt. The intangible assets will dwindle down over time, some faster than others, and it is not a strict cash outlay item, similar to depreciation. Further, their debt load isn’t over bearing, but they do have the ability to shrink that over time.
Third, relating to their dividend, the payout ratio is a tad high for my liking. Even though they have the 48+ year streak of dividend increases going, I foresee low 4-5% increases going forward. The dividend yield may come up to outweigh the growth rate, but will the dividend be safe in 3, 4 or 5 years? Given their aristocrat status, not sure if they would ever risk losing that title, but the payout ratio needs to come down a little.
In conclusion, at current prices, I would not be investing more into LEG’s stock at this time. If price comes down by $2 per share, I would be adding more, as the yield takes over the additional risk with lower growth rate, increased debt and payout ratio.