Hola, no lo he leído aún. Intento copiarlo
Why Piotroski’s F-Score No Longer Works
Summary
- I went back to Piotroski’s original 2000 paper and tried to exactly reproduce his results since publication.
- I found that his F-score no longer works on the group of stocks he selected.
- I came up with an alternative group of value stocks to apply his F-score to, and made some minor modifications. Performance dramatically improved.
- I do much more than just articles at The Stock Evaluator: Members get access to model portfolios, regular updates, a chat room, and more. Get started today »
This article is the fourth in a series about screens designed by famous investors. The first, on Benjamin Graham, can be found here; the second, on William O’Neil, can be found here; the third, on Joel Greenblatt, can be found here; the fourth, on Ken Fisher, can be found here; and for an overview of the subject, see my article “Can Screening for Stocks Still Generate Alpha?”
In 2000, Joseph D. Piotroski was a young associate professor of accounting at the University of Chicago Graduate School of Business, having obtained his Ph.D. from the University of Michigan the previous summer. That year he published a paper called “Value Investing: The Use of Historical Financial Statement Information to Separate Winners from Losers” in the Journal of Accounting Research. Seldom has an accounting paper made such a huge splash. In it, he showed that a strategy of investing in firms with high book-to-market ratios (in other words, companies that were very cheap if you compared their book value to their market cap) performed far better if you considered some basic accounting rules. The numbers were impressive: “an investment strategy,” he wrote, “that buys expected winners and shorts expected losers generates a 23% annual return between 1976 and 1996.” SmartMoney and BusinessWeek publicized the paper, and suddenly everyone was talking about Piotroski’s “F_SCORE.”
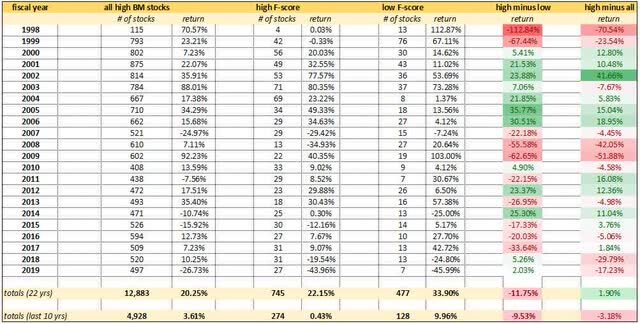
Unfortunately, Piotroski’s paper hasn’t held up well. Using the exact same criteria as Piotroski used to calculate his 23% annual return, if you were to buy expected winners and short expected losers over the last ten years, you would have generated an average annual loss of 9.53%. Over the last twenty, it’s even worse: 11.75%. Firms with low F-scores trounced firms with high F-scores. In other words, Piotroski’s experiment fit perfectly with his tested period and utterly failed post-publication.
In this article, I want to explain Piotroski’s original method, reexamine Piotroski’s experiment using data from the last ten and twenty years, offer a critique of his criteria, and suggest some modest improvements to his approach.
Piotroski’s basic principle was sound, in my opinion: if you’re going to rely on simple value ratios to identify “financially distressed” firms, it’s helpful to use accounting methods to separate the strong ones from the weak ones. Value investors must try as hard as they can to avoid value traps, and looking at their financial statements is absolutely essential to doing so. But Piotroski’s method signally failed on a number of metrics.
High Book-to-Market Firms
Piotroski chose to look at companies with high ratios of book value to market cap primarily because previous academic research had appeared to show that investing in such companies produced outsize returns. But why was this measure chosen rather than any other measure of value? After all, by this time the price-to-sales, price-to-earnings, and price-to-cash-flow ratios were all well known, and the ratio of unlevered free cash flow to enterprise value was being widely used in valuation calculations.
Piotroski justifies his use of the measure by three characteristics of these firms:
- they tend to be neglected;
- they tend not to participate very heavily in information dissemination outside of financial statements; and
- they tend to be “financially distressed.”
These factors seemed to make these firms a perfect group for studying how accounting measures can differentiate between the winners and losers among them. After all, as Piotroski points out,
From a valuation perspective, value stocks are inherently more conducive to financial statement analysis than growth (i.e., glamour) stocks. Growth stock valuations are typically based on long-term forecasts of sales and the resultant cash flows, with most investors heavily relying on nonfinancial information. Moreover, most of the predictability in growth stock returns appears to be momentum driven (Asness 1997). In contrast, the valuation of value stocks should focus on recent changes in firm fundamentals (e.g., financial leverage, liquidity, profitability, and cash flow adequacy).
The Nine Components of the F-score
Piotroski’s F-score is a checklist of nine rules. If every one of the following conditions is met, the F-score is nine; if every one is unmet, the F-score is zero. High F-score firms score eight or nine; low F-score firms score zero or one.
- Positive return on assets
- Positive cash flow from operations
- Most recent year’s return on assets greater than previous year’s
- Cash flow from operations greater than net income
- Most recent year’s debt-to-total assets ratio lower than previous year’s
- Most recent year’s current ratio greater than previous year’s
- No new equity issued
- Most recent year’s gross margin greater than previous year’s
- Most recent year’s asset turnover greater than previous year’s
Intuitively, most of these rules make sense. And Piotroski had a Ph.D. in accounting. He had studied how firms crunch their numbers. In his paper, he wrote, “I examine smaller, more financially distressed firms and the variables were chosen to measure profitability and default risk trends relevant for these companies.”
Piotroski readily admitted that using these completely binary signals “could potentially eliminate useful information. I adopted the binary approach because it is simple and easy to implement.” He then suggested that an alternative approach would be to essentially create a multifactor ranking system based on these factors and compare high-ranking stocks to low-ranking ones. This is an experiment that I will try as well.
Research Methodology
Piotroski’s research method was an elegant but curious one. For every year between 1976 and 1996, Piotroski first identified firms for which Compustat provided fiscal year-end numbers for book value and market cap. Piotroski then looked at those fiscal-year-end values and divided companies into five groups depending on the ratio of book value to market cap at that point. After forming these quintiles, he retained firms in the highest quintile that had sufficient Compustat data to calculate the various financial signals.
I call this curious for two reasons. First, this specific book-to-market ratio is not one that would have ever been used by any investor. You see, at the end of the fiscal period, an investor would have no way of knowing what the book value of equity was, since the company would not be announcing its figures for weeks; and by the time of announcement, when the book value would have been known, the market value of equity would often be quite different from what it was at the end of the period. An investor who was interested in buying high book-to-market stocks would have used the market value at the point of purchase, not at the end of the previous fiscal year. Second, many financial firms — especially banks — have never reported current ratios — they make no distinction between short-term and long-term assets and liabilities — so Piotroski seems to have excluded many firms in the financial sector from consideration. As these tend to be high book-to-market firms, he was excluding a large segment of the population that had informed earlier studies of high book-to-market firms.
At any rate, I was able to replicate Piotroski’s method by using the Compustat database via Portfolio123. I first excluded companies that were not on major exchanges. Piotroski doesn’t specifically state that he excluded such firms, but he does write quite a bit about delisted firms, so I assume he didn’t include those in his sample. I then excluded companies that did not file an annual report within the last 365 + 90 days (before 2002, companies had 90 days after the period’s end to file an annual report), then checked whether Compustat had values for both market cap on that date and for the book value reported then. I then ranked all those companies on the ratio of those two values and kept the top 20%. Lastly, I calculated the F-score of those companies and excluded any with an N/A for any of the nine fields. You can see the screen here (requires registration).
This left me with 12,883 firms over 21 years, which is comparable to Piotroski’s study of 14,043 firms, also over 21 years. Of course, some firms appear more than once, so the number of firms is probably lower.
Piotroski then measured the one-year return of each stock if you bought it on the first day of the fifth month after the end of the stock’s fiscal year. If a firm delisted, he assumed the delisting return was zero. (Again, I find this a strange assumption: often a firm is delisted because it veers close to bankruptcy, in which case the return would be close to –99% rather than 0%.)
In replicating Piotroski’s experiment, I did not assume the delisting return was zero, but instead used the actual returns of each stock, whether it was delisted or not.
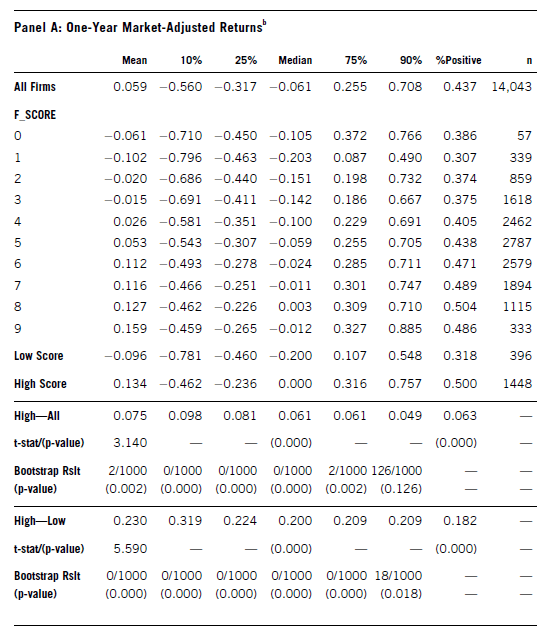
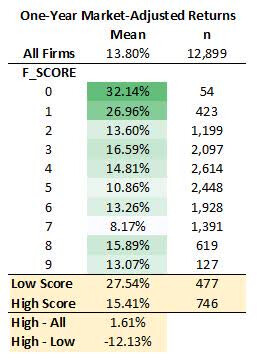
Results of Replicating Piotroski’s Experiment for 1998–2021
The year-by-year results of my experiment are shown earlier in the article. Below are the results broken down by F-score, which should be compared to Piotroski’s own results, reproduced first below.
And here’s how the returns compare visually:
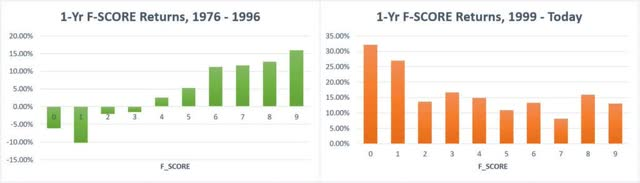
Clearly, Piotroski’s F-score no longer works. Low-scoring firms dramatically outperform the market; the rest are relatively indistinguishable by F-score.
Drilling Down to the F-score Components
As I wrote earlier, each component of the F-score except for the equity offering one could be written as a ranking formula, and Piotroski provides the necessary formulas. I tested each of them, taking the companies that pass Piotroski’s rules (high book-to-market and sufficient Compustat data to determine F-score), dividing them into deciles according to the factor in question, and looking at their one-year returns since 1999. Only one of the nine factors — accruals — showed that the favored deciles outperformed the disfavored ones. The rest either had middling values performing best or had no recognizable patterns governing the decile ranks. In sum, only the low-accruals criterion seems at all effective in the twenty-first century in separating good high-book-to-market firms from bad ones.
Why Does the Piotroski System Fail?
Piotroski did not make clear the process by which he arrived at his nine factors. It’s possible that they just arose off the top of his head, but it’s also possible that he tried fifty factors and chose the ones that worked best over the particular time period he studied and on the particular group of stocks he chose. It is telling that he omitted the years 1997 to 1999 from his study. I suspect his numbers would have been a lot worse had he included those frothy years.
But the crux of the matter is that Piotroski chose a group of stocks that no practical investor would have ever chosen and used criteria that would make little sense to an active investor. Central to these is the criterion of high book-to-market firms.
The Problem with the Book-to-Market Ratio
As any true value investor knows, a high book-to-market ratio has almost no relationship to whether or not a company is mispriced. That judgment must take into account a company’s potential to generate cash flow, so growth, earnings, revenue, and margin considerations are central to it. The book-to-market ratio can be helpful in finding stocks that are selling for less than their liquidation value and, along with earnings yield, for valuing stocks in the financial sector. But Piotroski excluded most financial-sector stocks by insisting that they have current ratios, and using the top 20% of book-to-market companies includes a whole lot more companies than those selling for less than their liquidation value.
Moreover, the book-to-market ratio assumes that a company’s liabilities have a totally negative contribution to its intrinsic value. This is simplistic, to say the least. A company’s future depends on how well it uses its capital. By subtracting all liabilities from assets to come up with book value, one ends up ignoring the immense contributions that debt (not to mention investable non-debt liabilities) can make to a company’s growth, focusing only on a source of capital — equity — that is far more expensive.
Different industries have very different aggregate book-to-market ratios for good reason. Does it make any sense to compare the book-to-market ratio of an energy company to that of a software developer? By choosing this metric, Piotroski heavily favored companies in certain industries, and those industries may not have responded that well to his criteria. What are those industries? Excluding banks (because Piotroski excluded them) and looking over the last 21 years, they are, in alphabetical order, capital markets, consumer goods (both staples and discretionary), consumer finance, energy, insurance, real estate, retail, transportation, and utilities. All of these industries depend heavily on their capital assets. Is this a good sample of industries to invest in? Are these all industries that would respond well to the Piotroski F-score criteria? Not really. Many of them are heavily regulated and others are tied to commodity prices; intuitively, accounting measures would tend to work better in separating good from bad firms in industries that are relatively unregulated and not heavily responsive to commodity pricing.
Lastly, Piotroski tested buying stocks exactly four months after the end of the fiscal year based on the ratio of their book value to their market cap then. This means comparing the book value of the stock to its price four months ago. No active investor would look at a stock’s price four months ago when deciding whether or not to purchase it. What is vital for any value investor is the price of the stock at that moment. A company’s book-to-market ratio might be completely different if the price had changed considerably over those four months.
How Would Piotroski’s F-score Perform on a Different Group of Value Stocks?
As an active investor, avoiding value traps is a big concern of mine, so modifying Piotroski’s F-score to separate cheap companies with potential from cheap companies that are deservedly cheap seems to me a worthwhile exercise. I’m therefore going to create a new system that attempts to do just that and see if it works better than Piotroski’s.
First, I’ll use a combination of four value ratios rather than simply book to market. They are: earnings yield (EPS divided by price), price to sales, unlevered free cash flow to enterprise value, and EBITDA to enterprise value. The first two will be measured against other stocks in the same GICS subsector and the last two will be measured against other stocks in general; where analyst estimates for the current fiscal year are available, those will be used, and where they are not, I’ll use the numbers for the trailing twelve months (TTM). Like Piotroski, I’ll consider only companies that rank in the top 20% of listed companies that have filed timely reports. Like Piotroski, each firm gets only one chance per year to be included, four months after the end of the fiscal year; but unlike Piotroski, I’ll be using current prices rather than four-month-old prices.
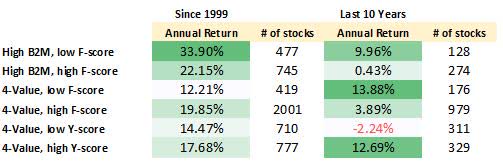
Because of the very different nature of these companies, the number of companies with high F-scores is far greater than the number of high book-to-market companies with high F-scores, and the number with low F-scores is far lower. These companies already have high earnings, for example. I’m therefore going to count low F-score firms as those that score 0, 1, or 2, rather than only 0 or 1, because there are barely a handful of those.
Now high F-score firms have an average annual return of 19.85% since 1999, but only 3.89% in the last ten years. Low F-score firms have an average annual return of 12.21% since 1999, and 13.88% in the last ten years. So if we look at the entire period, Piotroski’s F-score works far better on stocks in this value category than in the high book-to-market category. But in the last ten years there’s no improvement at all. It’s still a miserable failure.
The Problems with Piotroski’s Nine Factors
Piotroski’s first four factors — positive return on assets (which really means positive net income), positive cash flow from operations, an increase in return on assets, and negative total accruals — are profitability measures, and make good sense. Operating income and/or retained earnings may be more meaningful than net income in the first and third measures, and consistent ROA growth over the last few years is probably a better measure than simply one-year’s ROA growth. But those are quibbles.
His next three factors — a decrease in the debt-to-assets ratio, an increase in the current ratio, and no new equity issued — are, in Piotroski’s words, “designed to measure changes in capital structure and the firm’s ability to meet future debt service obligations.” To my mind, none of these do a very good job. Instead of comparing debt to total assets, it’s more logical to compare debt to EBITDA and/or to cash flow, since that’s what really determines whether a company can pay its debts. The amount of debt a company has paid back in the past year is, compared to its debt-to-EBITDA ratio, relatively meaningless. And when it comes to equity issuance, it makes little sense to not take into consideration equity purchases as well. Net equity issuance is certainly a better factor.
Piotroski’s last two factors — an increase in gross margin and an increase in asset turnover — are designed to measure operating efficiency. But once again, a one-year delta is relatively meaningless. I would suggest comparing the company’s gross margin to other companies in its industry, and taking a three-year or five-year look at asset turnover.
Modifying the F-score
One of my aims is to be more stringent than Piotroski was. Because the four value ratios I’m using already favor firms with good financials, I’m setting a somewhat higher bar for stocks that pass my checklist.
Modifying Piotroski’s checklist to a modest degree, these will be my measures:
- Positive three-year average retained earnings
- Sum of TTM cash flow from operations and cash flow from investments greater than 10% of revenue
- At least eight of last twelve quarters’ EPS greater than same quarter previous year
- Cash flow from operations greater than net income each of last three fiscal years
- TTM EBITDA greater than one-third of total debt
- Current ratio greater than one
- TTM equity purchased greater than equity issued
- TTM gross margin greater than subsector median
- Average five-year asset turnover greater than subsector median
Because my first name begins with a Y, I’ll call this the Y-score. I did no backtesting to see whether these factors would work better than Piotroski’s, or to pick and choose among various factors. Instead I simply took each of Piotroski’s factors and tried to improve it, relying on the research into fundamentals I’ve done over the last five years. If you’re a Portfolio123 subscriber, you can see the screen here.
Over the entire 1999 to 2020 period, value stocks with a high Y-Score returned 17.68%, compared to 14.46% for stocks with a low Y-score (once again, low means 0, 1, or 2). Over the last ten years, the numbers are 12.69% for high Y-score value stocks and –2.24% for low Y-score value stocks. Here’s a chart that sums up the entire experiment:
Conclusion
What lessons can we learn from Piotroski’s out-of-sample failure?
- Backtesting can be fickle. One might think that a 22-year backtest of a relatively simple system would have sticking power. However, as I’ve shown with Joel Greenblatt’s system, such is not at all the case.
- Backtesters have responsibilities. There is nothing in Piotroski’s article telling us how many factors he tested, how he chose the nine factors he ended up with, or why he skipped the years 1997 through 1999. All of these should have been disclosed in his paper.
- Don’t publish results that are not truly actionable. As I pointed out several times, no actual investor would ignore the price of a stock today and instead look at its price four months ago.
- Before you publish papers on investing, go out and invest. There is no evidence that Piotroski ever actually practiced the fine art of investing prior to writing his paper.
- The main flaws of Piotroski’s system, in my opinion, stem from two measures: book value and the debt-to-assets ratio. If you subtract a company’s liabilities from its assets, you get the value of its equity (its book value), and if you want to know how much of a company’s ROA is derived from its equity and how much is from its debt, you simply use the debt-to-assets ratio. Debt is more risky than equity but far cheaper, and one should not necessarily privilege the use of one over the other. After all, ROE is the product of asset turnover, net profit margin, and the assets-to-equity ratio, which has a one-to-one correlation with the debt-to-assets ratio: as the ratio of debt to assets goes up, so does the ratio of assets to equity, and therefore so does ROE. The book-to-market ratio indeed tells you how much your shares are worth in case of liquidation, but provides absolutely no guidance about the future of a company, and that is what really matters in the stock market.
- One-year deltas (the change in a measure like current ratio, asset turnover, gross margin, or debt ratio over one year) will tell you very little about a company’s one-year prospects. Three-year and five-year deltas are more helpful, as are comparing those ratios to those of other companies.
Some Companies with High F-scores and High Y-Scores
If you were to go out into the market armed with Piotroski’s method and with my method, what stocks would you choose?
Seven companies currently score 9 out of 9 using Piotroski’s criteria: DHT (DHT), Fuwei Films (FFHL), IT Tech Packaging (ITP), Dorian LPG (LPG), Precision Drilling (PDS), Teekay Tankers (TNK), and USA Truck (USAK). Four of these are energy companies, which tend to have high book-to-market ratios. Almost all of them have seen huge price increases since their book-to-market value was determined in their most recent annual statement. In my opinion, this is a very arbitrary selection of stocks. Their current book-to-market ratios vary from 0.16 (PDS) to 4.54 (ITP). Of these seven stocks, only FFHL and USAK strike me as wise investments.
Seven companies currently score 9 out of 9 using my Y-score and 4-value criteria: Atkore (ATKR), Biogen (BIIB), Eli Lilly (LLY), Merck (MRK), Thermo Fisher Scientific (TMO), USANA Health Sciences (USNA), and Williams-Sonoma (WSM). With the exception of BIIB, I would definitely recommend the latter group of stocks over the former at this time. They seem to me like strong, reliable companies that are priced for success.
Editor’s Note: This article covers one or more microcap stocks. Please be aware of the risks associated with these stocks.