Hola! Còmo puedo acceder a la entrevista de las Cartas del dividendo?
Vía inscripción, 99€/año. Creo que también venden los números sueltos.
Por cierto, es una buena entrevista.
1 me gusta
Efectivamente o pagando la suscripción anual o comprando el último número. Todo en su web.
Me uno a la recomendación. Debería de leerla todas las semanas. Ya llevo 3 ![]()
"I was looking for industrial companies who have raised their dividend for 25 or more consecutive years and also outperformed the S&P 500 in “total return” for the 1-3-5-10-20 year time frames. The following companies beat the market in all five of those time frames.
Yield was not a factor, nor was a minimum dividend growth requirement. All I was looking for were the best performing industrial’s in total return that were Aristocrats.
These companies may be better suited for young to middle aged people who have time for total return to grow before retirement age when income may become more of a focus.
- The best performing industrial has been Deere & Co. (DE). Deere & Company manufactures and distributes various equipment worldwide. The company operates through three segments: Agriculture and Turf, Construction and Forestry, and Financial Services. The Agriculture and Turf segment provides various agriculture and turf equipment, and related service parts, including large, medium, and utility tractors; tractor loaders; combines, cotton pickers, cotton strippers, and sugarcane harvesters; harvesting front-end equipment; sugarcane loaders and pull-behind scrapers; tillage, seeding, and application equipment comprising sprayers, nutrient management, and soil preparation machinery; self-propelled forage harvesters and attachments, balers, and mowers; riding lawn equipment, golf course equipment, utility vehicles, and commercial mowing equipment along with associated implements; integrated agricultural solutions and precision technologies; and other outdoor power products.
In beating the market in all five time frames, the 20 year is most impressive. DE had a 17.94%CAGR to the S&P 500 at a 6.83% CAGR. DE outperformed by almost 3x the market.
- Second best in long term performance has been MSA Safety Inc. (MSA). MSA Safety develops, manufactures, and supplies safety products that protect people and facility infrastructures in the oil, gas, petrochemical, fire service, construction, industrial manufacturing applications, utilities, military, and mining industries in North America, Latin America, and internationally. The company’s core product offerings include permanently installed fixed gas and flame detection instruments, such as permanently installed gas detection monitoring systems, and flame detectors and open-path infrared gas detectors, as well as replacement components and related services to detect the presence or absence of various gases in the air.
It’s 20 year CAGR came in at 17.40%, just a tad below DE and it too beat the market at alomost 3x in performance. S&P 500 a 6.83% CAGR.
- This is the third and last industrial to beat the market in all 5 time frames. That company is Parker-Hannifin (PH). Parker-Hannifin manufactures and sells motion and control technologies and systems for various mobile, industrial, and aerospace markets worldwide. The company operates through two segments, Diversified Industrial and Aerospace Systems. The Diversified Industrial segment offers sealing, shielding, thermal products and systems, adhesives, coatings, and noise vibration and harshness solutions; filters, systems, and diagnostics solutions to monitor and remove contaminants from fuel, air, oil, water, and other liquids and gases; connectors, which control, transmit, and contain fluid; control solutions for extreme corrosion resistance, temperatures, pressures, and precise flow; and hydraulic, pneumatic, and electromechanical components and systems for builders and users of mobile and industrial machinery and equipment.
It’s 20 year CAGR came in at 14.16% to the S&P 500 at 6.83%
DE, MSA and PH are the only Aristocrat Industrial’s to beat the market in the 1, 3 , 5, 10 and 20 year time frames.
"
13 Me gusta
Por si un día le da por borrar todo como ha hecho en S.A., pego esta cartera.
Alguien sobre los 50 años, que empezó tarde. Y ya tiene un valor de mercado de 546k.
"This thread was set up to show how I manage a Young and Older Folk Portfolio. I have had many requests to share how I manage for someone middle aged. The portfolio I show here today is for someone in their 50’s who got a late start in life with investing.
My goal is to try to present a balance between high dividend cash flows, dividend growth, and capital gain potential, so there will be a mix of assets.
Portfolio Balance: $546,263
Forward 12 months income: $20,681
Portfolio yield: 3.79%
Dividend Growth 5 Years: 6.30%
Chowder Number: 10.06
Holdings: 52
Beta: 0.69
Full Position: $20,000
Full CEF Position: $8,000
Symbol … Market Value … % of Account
O … $40,708 … 7.5%
DUK … $39,888 … 7.3%
ABBV … $29,015 … 5.3%
KO … $23,127 … 4.2%
ADP … $21,272 … 3.9%
NEE … $21,009 … 3.8%
PG … $20,011 … 3.7%
SO … $19,809 … 3.6%
JNJ … $19,598 … 3.6%
ABT … $18,782 … 3.4%
UTG … $15,289 … 2.8% (CEF)
DNP … $15,146 … 2.8% (CEF)
PEP … $12,851 … 2.4%
AVGO … $12,830 … 2.3%
PRU … $12,312 … 2.3%
ETV … $11,753 … 2.2% (CEF)
MKC … $11,362 … 2.1%
IRM … $10,983 … 2.0%
KMB … $9,459 … 1.7%
MSFT … $9,383 … 1.7%
HD … $9,326 … 1.7%
MO … $9,112 … 1.7%
LOW … $8,899 … 1.6%
RNP … $8,874 … 1.6% (CEF)
LYB … $8,741 … 1.6%
AAPL … $8,369 … 1.5%
TD … $8,060 … 1.5%
BIP … $7,068 … 1.3%
BST … $6,544 … 1.2% (CEF)
EOS … $6,081 … 1.1% (CEF)
ENB … $5,979 … 1.1%
RY … $5,957 … 1.1%
CM … $5,870 … 1.1%
SBUX. … $5,824 … 1.1%
LMT … $5,358 … 1.0%
MMP … $5,155 … 0.9%
TSN … $5,036 … 0.9%
QQQX … $5,029 … 0.9% (CEF)
BTO … $5,020 … 0.9% (CEF)
TROW … $4,956 … 0.9%
EPD … $4,748 … 0.9%
RIO … $4,206 … 0.8%
SYY … $4,147 … 0.8%
DLR … $3,581 … 0.7%
CCI … $3,565 … 0.7%
TXN … $3,347 … 0.6%
LEG … $3,059 … 0.6%
EVG … $3,057 … 0.6% (CEF)
GOF … $2,887 … 0.5%
LANC … $2,051 … 0.4%
WPC … $1,021 … 0.2%
ASG … $750 … 0.1% (CEF)"
14 Me gusta
Curioso y nada habitual en carteras que la primera posicion sea O
1 me gusta
Bueno.
La verdad, es que en caso de Chowder, si no dice cuál es el objetivo de esa cartera, no hay posibilidad de saber cómo actúa (y a veces ni por esas  ).
).
Pero no me parece mala opción, con flujo mensual de dividendos que junto a la aportación mensual le permitan seguir comprando. Casi 42k de O es mucho dinero entrante.
Y también lleva CEF (algo ya habitual en todas sus carteras).
En fin, ya veremos si sigue diciendo cosas de esta cartera.
Por cierto, que este verano hizo tantos cambios en la carteras que publica (incluido su hijo) que cuesta seguirlo.
Haría falta papel y lápiz.
D, T, y VZ han ido fuera.
3 Me gusta
A ver si ahora que he decidido no moverme ni vender, me pongo a seguir a Chowder y me vuelve loco 
De todas formas, en la epoca que yo vendia y compraba como loco, no es que siguiera a Chowder, pero sigo pensando que segun que valores no me parece mala opcion.
2 Me gusta
A mi tampoco me convencen ni D ni T ni VZ y eso que aún llevo T, D me deshice de ella por el recorte de dividendo y T, ya veremos, dw momento la aguanto, pero a regañadientes.
2 Me gusta
Hola,
¿alguno sabe si el criterio de construccion de cartera de ir aportando a todas las posiciones, indendientemente de la valoración de las empresas, lo aplica a los middle age con 15-20 años hasta la jubilacion?
Respuesta de Chowder:
6 Me gusta
Nada mejor que te responda el propio Chowder…que nivel hay en este foro. 
2 Me gusta
Ya puestos….
Alguno ha utilizado value line para ver fair value, (debo estar espeso porque no lo localizo).
2 Me gusta
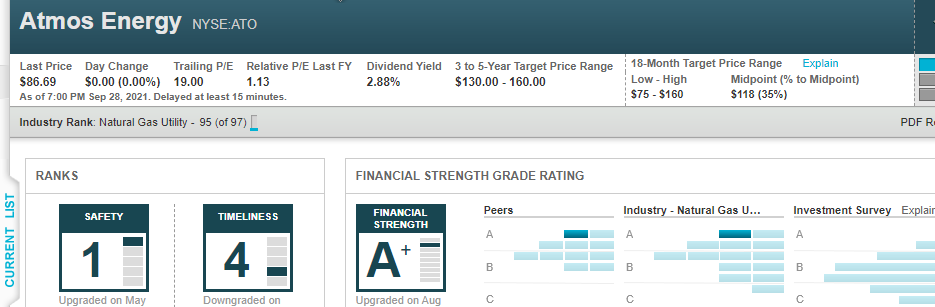
@Marcos_Torcal_Garcia explicó recientemente como calculaba el fair value teniendo en cuenta algunos parámetros de Value Line pero me declaro incompetente para encontrar el post.
hola, no lo encuentro ¿tienes link?
gracias
2 Me gusta
gracias por responder, podrías aclararme una cosa:
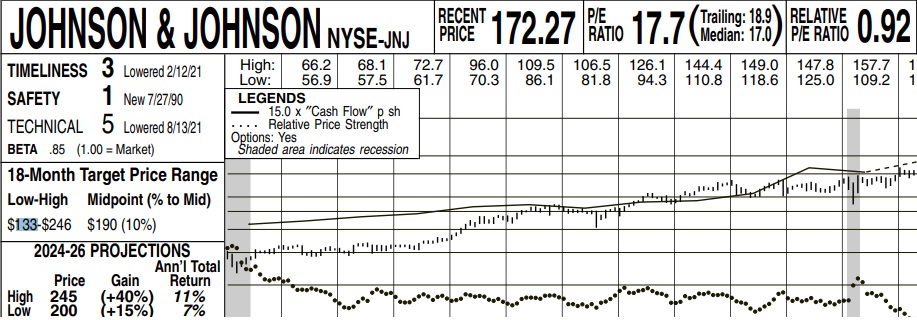
este es el cuadro de jnj.
El anual total return hace referencia a la proyección que tendrá en el futuro, en este caso el low del 7%. Podrías aclarar de donde sale esa rentabilidad, según fair value , porque no me salen las cifras de ninguna manera. ¿a qué precio de compra hace referencia para que salga esa rentabilidad?.
un saludo
1 me gusta
Sinceramente no lo sé. Tendrías que mirar en el faq de VL para saberlo. Tal como lo entiendo yo, para que suba un 15% el precio en 3-4 años tiene que subir el precio anualmente un 4-5%. A eso tienes que sumarle la rentabilidad por dividendo más el crecimiento que estos puedan tener en ese periodo para obtener el total return.
No he hecho los números, pero de un primer vistazo parecen correctas las estimaciones de total return.
2 Me gusta