Bueno, es el TER correspondiente más ese 0.19% de comisión de custodia. Aclaro.
Una de las cosas que me mata es tener el seguimiento historico de los datos de DPS y sobre todo de EPS de las acciones en cartera.
Esto es una de las pestañas de mi Google Spreadsheet donde tengo la informacion de las inversiones. A veces dudo si borrar esta pestaña y liberar mi mente 
| Average Target Price | DPS 2000 | DPS 2001 | DPS 2002 | DPS 2003 | DPS 2004 | DPS 2005 | DPS 2006 | DPS 2007 | DPS 2008 | DPS 2009 | DPS 2010 | DPS 2011 | DPS 2012 | DPS 2013 | DPS 2014 | DPS 2015 | DPS 2016 | DPS 2017 | DPS 2018 | DPS 2019 | DPS 2020 | DPS 2021 | DPS 2022 | DPS 2023 | EPS 2002 | EPS 2003 | EPS 2004 | EPS 2005 | EPS 2006 | EPS 2007 | EPS 2008 | EPS 2009 | EPS 2010 | EPS 2011 | EPS 2012 | EPS 2013 | EPS 2014 | EPS 2015 | EPS 2016 | EPS 2017 | EPS 2018 | EPS 2019 | EPS 2020 | EPS 2021 | EPS 2022 | EPS 2023 | ||
|---|---|---|---|---|---|---|---|---|---|---|---|---|---|---|---|---|---|---|---|---|---|---|---|---|---|---|---|---|---|---|---|---|---|---|---|---|---|---|---|---|---|---|---|---|---|---|---|---|
| ABBOTT LABORATORIES | 130.28 | 2021 | x | x | x | x | x | x | x | x | x | x | x | x | x | 0.64 | 0.9 | 0.98 | 1.045 | 1.075 | 1.16 | 1.32 | 1.53 | 1.71 | 1.82 | 1.98 | x | x | x | x | x | x | x | x | x | x | x | 1.64 | 1.98 | 2.15 | 2.2 | 2.5 | 2.88 | 3.24 | 3.65 | 3.3 | 3.6 | 4.16 |
| ABBVIE INC | 125.48 | 2021 | x | x | x | x | x | x | x | x | x | x | x | x | x | 2 | 1.75 | 2.1 | 2.35 | 2.63 | 3.95 | 4.39 | 4.84 | 5.12 | 5.53 | 5.66 | x | x | x | x | x | x | x | x | x | x | x | 3.14 | 3.32 | 4.29 | 4.82 | 5.6 | 7.91 | 8.94 | 10.56 | 7.32 | 9.01 | 7.73 |
| ACTIVISION BLIZZARD INC | 113.05 | 2021 | x | x | x | x | x | x | x | x | x | x | 0.15 | 0.165 | 0.18 | 0.19 | 0.2 | 0.23 | 0.26 | 0.3 | 0.34 | 0.37 | 0.41 | 0.47 | 0.53 | 0.57 | x | x | x | x | x | x | -0.08 | 0.69 | 0.79 | 0.93 | 1.18 | 0.94 | 1.24 | 1.3 | 2.18 | 2.21 | 2.72 | 2.31 | 3.21 | 3.24 | 3.69 | 4 |
| ADMIRAL GROUP PLC | 2,859.79 | 2021 | x | x | x | x | 9.3 | 24.6 | 36.1 | 43.8 | 52.5 | 57.5 | 68.1 | 75.6 | 90.6 | 99.5 | 98.4 | 114.4 | 114.4 | 114 | 126 | 140 | 156.5 | 297 | 177 | 148 | x | x | 35 | 32.7 | 39.8 | 48.6 | 54.9 | 59 | 72.2 | 81.7 | 94.9 | 104.4 | 102.8 | 107.1 | 78.5 | 117 | 136.8 | 148 | 179.2 | 351 | 149 | 151 |
| AIR PRODUCTS & CHEMICALS INC | 314.43 | 2021 | 0.74 | 0.78 | 0.82 | 0.88 | 1.04 | 1.25 | 1.34 | 1.48 | 1.7 | 1.79 | 1.92 | 2.23 | 2.5 | 2.77 | 3.02 | 3.2 | 3.39 | 3.71 | 4.25 | 4.58 | 5.18 | 5.84 | 6.33 | 6.93 | 2.36 | 1.78 | 2.64 | 3.08 | 3.18 | 4.64 | 4.15 | 2.96 | 4.74 | 5.63 | 5.44 | 4.68 | 4.61 | 5.88 | 2.89 | 13.65 | 6.78 | 7.94 | 8.49 | 9.15 | 10.5 | 11.9 |
| ALTRIA GROUP INC | 53.31 | 2021 | x | x | x | x | x | x | x | x | 0.93 | 1.32 | 1.46 | 1.58 | 1.7 | 1.84 | 2 | 2.17 | 2.35 | 2.54 | 3 | 3.28 | 3.4 | 3.52 | 3.73 | 3.95 | x | x | x | x | x | x | 1.65 | 1.75 | 1.9 | 2.05 | 2.21 | 2.38 | 2.57 | 2.8 | 3.03 | 3.39 | 3.99 | 4.21 | 4.36 | 4.24 | 4.66 | 4.85 |
| A.O. SMITH CORP | 74.00 | 2021 | 0.08333333333 | 0.08666666667 | 0.09 | 0.09666666667 | 0.1033333333 | 0.1066666667 | 0.11 | 0.1166666667 | 0.1233333333 | 0.1283333333 | 0.135 | 0.15 | 0.18 | 0.23 | 0.3 | 0.38 | 0.48 | 0.56 | 0.76 | 0.9 | 0.98 | 1.06 | 1.1 | 1.13 | 0.31 | 0.2933333333 | 0.1966666667 | 0.2566666667 | 0.4116666667 | 0.475 | 0.45 | 0.34 | 0.43 | 0.54 | 0.78 | 1.03 | 1.22 | 1.58 | 1.85 | 2.17 | 2.61 | 2.22 | 2.16 | 2.77 | 3.25 | 3.57 |
| BAE SYSTEMS PLC | 627.72 | 2021 | 8.5 | 9 | 9.2 | 9.2 | 9.5 | 10.3 | 11.3 | 12.8 | 14.5 | 16 | 17.5 | 18.8 | 19.5 | 20.1 | 20.5 | 20.9 | 21.3 | 21.8 | 22.2 | 23.2 | 23.7 | 25 | 26 | 27 | 17.3 | 16.6 | 18.4 | 21.7 | 53.1 | 30.4 | 37 | 40.6 | 42.1 | 45.3 | 38.5 | 41.8 | 37.9 | 40.1 | 40.1 | 41.9 | 42.8 | 50.5 | 46.5 | 43 | 47 | 49 |
| BRITISH AMERICAN TOBACCO PLC | 3,508.07 | 2021 | 29 | 32 | 35.2 | 38.8 | 41.9 | 47 | 55.9 | 66.2 | 83.7 | 99.5 | 114.2 | 126.5 | 134.9 | 142.4 | 148.1 | 154 | 169.4 | 295.3 | 203 | 210.4 | 215.6 | 218 | 228 | 242 | 66.54 | 69.21 | 76.67 | 89.48 | 98.6 | 108.53 | 128.78 | 151.6 | 173.4 | 191.9 | 205.2 | 216.6 | 208.1 | 208.4 | 247.5 | 282.1 | 296.7 | 323.8 | 331.7 | 311 | 333 | 350 |
| BROADCOM INC | 548.67 | 2021 | x | x | x | x | x | x | x | x | x | x | x | 0.35 | 0.56 | 0.8 | 1.13 | 1.55 | 1.94 | 4.08 | 7 | 10.6 | 13 | 14.4 | 16 | 17.1 | x | x | x | x | x | x | x | 0.66 | 2.19 | 2.7 | 2.77 | 2.89 | 4.9 | 8.98 | 11.45 | 16.02 | 20.82 | 21.29 | 22.16 | 15.4 | 18.9 | 21 |
| CELANESE CORP CLASS A | 178.74 | 2021 | x | x | x | x | x | 0.08 | 0.16 | 0.16 | 0.16 | 0.16 | 0.18 | 0.22 | 0.27 | 0.525 | 0.93 | 1.15 | 1.38 | 1.74 | 2.08 | 2.4 | 2.48 | 2.72 | 2.85 | 3.06 | x | x | x | 1.67 | 2.36 | 2.49 | 2.76 | 1.58 | 3.22 | 4.51 | 4.07 | 4.5 | 5.67 | 6.02 | 6.61 | 7.51 | 11 | 9.53 | 7.64 | 16.2 | 14.1 | 16 |
| CORESITE REALTY CORP | 137.57 | 2021 | x | x | x | x | x | x | x | x | x | x | 0.13 | 0.57 | 0.81 | 1.16 | 1.47 | 1.79 | 2.39 | 3.58 | 4.14 | 4.76 | 4.89 | 5.04 | 5.21 | 5.59 | x | x | x | x | x | x | x | x | 0.25 | 1.24 | 1.55 | 1.82 | 2.22 | 2.86 | 3.71 | 4.52 | 5.06 | 5.1 | 5.31 | 2.04 | 2.25 | 2.63 |
| DOMINO’S PIZZA INC | 535.73 | 2021 | x | x | x | x | 0.065 | 0.4 | 0.48 | 13.5 | 0 | 0 | 0 | 0 | 3 | 0.8 | 1 | 1.24 | 1.52 | 1.84 | 2.2 | 2.6 | 3.12 | 3.76 | 4.23 | 4.83 | x | x | 1.12 | 1.43 | 1.56 | 1.03 | 0.75 | 0.87 | 1.35 | 1.69 | 2.02 | 2.45 | 2.9 | 3.45 | 4.3 | 5.91 | 8.42 | 9.57 | 12.01 | 13.7 | 15.7 | 18 |
| ENAGAS SA | 18.58 | 2021 | x | x | 0.23053 | 0.29744 | 0.331175 | 0.399944 | 0.471809 | 0.598874 | 0.650641 | 0.749027 | 0.83812325 | 0.99280956 | 1.1127683 | 1.26662715 | 1.3 | 1.32 | 1.39 | 1.46 | 1.53 | 1.6 | 1.68 | 1.7 | 1.67 | 1.68 | 0.46 | 0.59 | 0.662318731 | 0.799886066 | 0.906381161 | 0.9981 | 1.0844 | 1.2484 | 1.3969 | 1.5274 | 1.5897 | 1.6888 | 1.7029 | 1.7285 | 1.7499 | 2.0587 | 1.8546 | 1.7688 | 1.698 | 1.49 | 1.47 | 1.43 |
| ENBRIDGE INC | 55.11 | 2021 | 0.3175 | 0.35 | 0.38 | 0.415 | 0.4575 | 0.51875 | 0.575 | 0.615 | 0.66 | 0.74 | 0.85 | 0.98 | 1.13 | 1.26 | 1.4 | 1.86 | 2.12 | 2.413 | 2.684 | 2.952 | 3.24 | 3.34 | 3.48 | 3.61 | 0.67 | 0.75 | 0.735 | 0.795 | 0.87 | 0.895 | 0.94 | 1.175 | 1.3 | 1.44 | 1.61 | 1.78 | 3.02 | 3.72 | 4.08 | 3.68 | 4.42 | 4.57 | 4.67 | 2.82 | 3.05 | 3.15 |
| ENERGY TRANSFER LP | 14.44 | 2021 | x | x | x | x | x | x | 0.23695 | 0.417125 | 0.4775 | 0.53375 | 0.54 | 0.60875 | 0.6275 | 0.66625 | 0.801875 | 1.08 | 1.14 | 1.17 | 1.22 | 1.22 | 0.915 | 0.61 | 0.63 | 0.69 | x | x | x | x | 0.1975 | 0.3875 | 0.4844411494 | 0.5528745784 | 0.5567231382 | 0.5710285824 | 0.6251827043 | 0.64 | 0.82 | 1.24 | 1.151602104 | 0.9144871081 | 2.05810491 | 2.376712329 | 2.129025078 | 2.08 | 1.38 | 1.48 |
| ENTERPRISE PRODUCTS PARTNERS LP | 28.19 | 2021 | 0.525 | 0.596875 | 0.68 | 0.735 | 0.77 | 0.84875 | 0.9125 | 0.97375 | 1.0375 | 1.0975 | 1.1575 | 1.2175 | 1.28625 | 1.37 | 1.45 | 1.53 | 1.61 | 1.6825 | 1.725 | 1.765 | 1.785 | 1.81 | 1.83 | 1.89 | 0.6447121728 | 0.6090425769 | 0.828349603 | 1.066673167 | 1.028606493 | 1.00387812 | 1.393466101 | 1.346799141 | 1.511199811 | 2.259196913 | 2.388982233 | 2.087430058 | 2.184759074 | 2.825510978 | 1.946412458 | 2.083869463 | 2.735377963 | 3.00776154 | 2.912235644 | 2.19 | 2.17 | 2.3 |
| HANNON ARMSTRONG SUSTAINABLE INFRASTRUCTURE CAPITAL INC | 65.80 | 2021 | x | x | x | x | x | x | x | x | x | x | x | x | x | 0.42 | 0.92 | 1.08 | 1.23 | 1.32 | 1.32 | 1.34 | 1.36 | 1.4 | 1.47 | 1.55 | x | x | x | x | x | x | x | x | x | x | x | 0.43 | 0.93 | 1.04 | 1.2 | 1.27 | 1.38 | 1.4 | 1.55 | 1.3 | 1.07 | 1.35 |
| HENKEL AG & CO KGAA | 94.75 | 2021 | 0.3533333333 | 0.3533333333 | 0.3533333333 | 0.38 | 0.4133333333 | 0.4333333333 | 0.48 | 0.51 | 0.51 | 0.51 | 0.7 | 0.78 | 0.93 | 1.2 | 1.29 | 1.45 | 1.6 | 1.77 | 1.83 | 1.83 | 1.83 | 1.85 | 1.93 | 2 | 1.323333333 | 1.426666667 | 1.726666667 | 1.75 | 1.973333333 | 2.17 | 2.17 | 1.89 | 2.8 | 3.12 | 3.61 | 4.05 | 4.36 | 4.86 | 5.34 | 5.83 | 5.99 | 5.41 | 4.24 | 4.18 | 4.69 | 5.1 |
| IMPERIAL BRANDS PLC | 1,953.71 | 2021 | x | x | x | x | x | x | x | x | 42.2 | 73 | 84.3 | 95.1 | 105.6 | 116.4 | 128.1 | 141 | 155.2 | 170.72 | 187.79 | 206.57 | 137.71 | 141 | 145 | 151 | x | x | x | x | x | x | 136.4 | 161.4 | 178.3 | 187.4 | 200.4 | 210.1 | 202.8 | 211.9 | 248.9 | 266.4 | 271.3 | 271.8 | 254.1 | 235 | 188 | 204 |
| INDUSTRIA DE DISENO TEXTIL SA | 32.13 | 2021 | x | 0.022 | 0.028 | 0.07 | 0.096 | 0.134 | 0.168 | 0.21 | 0.21 | 0.24 | 0.32 | 0.36 | 0.44 | 0.484 | 0.52 | 0.6 | 0.68 | 0.75 | 0.88 | 0.35 | 0.7 | 0.94 | 1.08 | 1.19 | 0.1406 | 0.1432 | 0.2056 | 0.2588 | 0.3226 | 0.4028 | 0.4032 | 0.4228 | 0.5558 | 0.62 | 0.7574 | 0.763 | 0.803 | 0.923 | 1.014 | 1.082 | 1.106 | 1.168 | 0.355 | 1.17 | 1.28 | 1.4 |
| INTER PARFUMS INC | 88.00 | 2021 | x | x | 0.04 | 0.05333333333 | 0.08 | 0.1066666667 | 0.1066666667 | 0.1333333333 | 0.1323333333 | 0.132 | 0.26 | 0.32 | 0.32 | 0.96 | 0.48 | 0.52 | 0.62 | 0.72 | 0.905 | 1.155 | 0.33 | 1 | 1.08 | 1.18 | 0.3133333333 | 0.46 | 0.5133333333 | 0.5 | 0.5733333333 | 0.76 | 0.77 | 0.74 | 0.87 | 1.05 | 4.26 | 1.27 | 0.95 | 0.98 | 1.07 | 1.33 | 1.71 | 1.9 | 1.21 | 1.95 | 2.26 | 2.26 |
| INTERNATIONAL FLAVORS & FRAGRANCES INC | 162.95 | 2021 | 1.29 | 0.6 | 0.6 | 0.63 | 0.685 | 0.73 | 0.765 | 0.88 | 0.96 | 1 | 1.04 | 1.16 | 1.3 | 1.46 | 1.72 | 2.06 | 2.4 | 2.66 | 2.84 | 2.96 | 3.04 | 2.96 | 3.15 | 3.43 | 1.92 | 2.12 | 2.27 | 1.94 | 2.32 | 2.66 | 2.76 | 2.69 | 3.37 | 3.74 | 3.98 | 4.46 | 5.08 | 5.25 | 5.51 | 6.23 | 6.23 | 6.17 | 5.7 | 1.25 | 3.61 | 4.55 |
| INTERTEK GROUP PLC | 5,657.37 | 2021 | x | x | 5.2 | 8.8 | 10.4 | 12 | 14.8 | 18 | 20.8 | 25.5 | 28.1 | 33.7 | 41 | 46 | 49.1 | 52.3 | 62.4 | 71.3 | 99.1 | 105.8 | 105.8 | 108 | 113 | 121 | 26.9 | 29.7 | 34.3 | 39.1 | 43.2 | 48.8 | 67.1 | 81.5 | 89.4 | 107.2 | 131.2 | 138.6 | 132.1 | 140.7 | 167.7 | 191.6 | 198.3 | 212.5 | 170.9 | 171 | 195 | 210 |
| IRON MOUNTAIN INC | 43.14 | 2021 | x | x | x | x | x | x | x | x | x | x | 0.375 | 0.9375 | 5.1215 | 1.08 | 5.3594 | 1.91 | 2.005 | 2.2375 | 2.3735 | 2.4515 | 2.474 | 2.5 | 2.54 | 2.6 | 0.3 | 0.4333333333 | 0.48 | 0.56 | 0.64 | 0.75 | 0.39 | 1.07 | -0.29 | 2.02 | 0.98 | 0.5 | 2.680877666 | 2.552178504 | 2.706556071 | 2.819123461 | 3.009321375 | 3.01 | 3.07 | 1.52 | 1.45 | 1.38 |
| JOHN WILEY & SONS INC CLASS A | 62.33 | 2021 | 0.16 | 0.18 | 0.2 | 0.26 | 0.3 | 0.36 | 0.4 | 0.44 | 0.52 | 0.56 | 0.64 | 0.8 | 0.96 | 1 | 1.16 | 1.2 | 1.24 | 1.28 | 1.32 | 1.36 | 1.37 | 1.38 | 1.54 | 1.38 | 1.41 | 1.35 | 1.85 | 1.71 | 2.49 | 2.15 | 2.41 | 2.8 | 3.12 | 2.92 | 3.05 | 3.26 | 2.7 | 3.01 | 3.43 | 2.96 | 2.4 | 2.92 | 2.98 | 3.11 | ||
| LOWE’S COMPANIES INC | 228.74 | 2021 | 0.035 | 0.03875 | 0.0425 | 0.055 | 0.075 | 0.11 | 0.18 | 0.29 | 0.335 | 0.355 | 0.42 | 0.53 | 0.62 | 0.7 | 0.87 | 1.07 | 1.33 | 1.58 | 1.85 | 2.13 | 2.3 | 3 | 3.21 | 3.57 | 0.93 | 1.13 | 1.35 | 1.73 | 1.99 | 1.86 | 1.49 | 1.21 | 1.42 | 1.43 | 1.69 | 2.14 | 2.71 | 3.29 | 3.99 | 4.39 | 5.11 | 5.74 | 8.86 | 11.3 | 12.1 | 13.9 |
| MAGELLAN MIDSTREAM PARTNERS LP | 51.60 | 2021 | x | 0.5055 | 0.678125 | 0.7925 | 0.880625 | 1.030625 | 1.1675 | 1.27375 | 1.38625 | 1.42 | 1.4775 | 1.585 | 1.87625 | 2.1825 | 2.615 | 3.005 | 3.315 | 3.5875 | 3.87 | 4.065 | 4.11 | 4.11 | 4.13 | 4.17 | 0.9175 | 0.8275 | 0.86 | 1.015 | 1.12 | 1.3 | 1.635 | 1.11 | 1.825633648 | 2.040740183 | 2.391843987 | 2.952532525 | 3.87428056 | 4.143502527 | 4.156980774 | 4.476246406 | 4.85926779 | 5.674255876 | 4.631738824 | 4.2 | 4.19 | 4.58 |
| MASTERCARD INC CLASS A | 433.88 | 2021 | x | x | x | x | x | x | 0.018 | 0.06 | 0.06 | 0.06 | 0.06 | 0.06 | 0.12 | 0.29 | 0.49 | 0.67 | 0.79 | 0.91 | 1.08 | 1.39 | 1.64 | 1.76 | 1.78 | 1.92 | x | x | x | x | 0.337 | 0.758 | 0.941 | 1.119 | 1.405 | 1.87 | 2.204 | 2.61 | 3.1 | 3.43 | 3.77 | 4.58 | 6.49 | 7.77 | 6.43 | 8.28 | 10.6 | 13 |
| MERCK & CO INC | 95.00 | 2021 | 1.26 | 1.38 | 1.42 | 1.46 | 1.5 | 1.52 | 1.52 | 1.52 | 1.52 | 1.52 | 1.52 | 1.56 | 1.69 | 1.73 | 1.77 | 1.81 | 1.85 | 1.89 | 1.99 | 2.26 | 2.48 | 2.59 | 2.81 | 3.03 | 3.14 | 3.03 | 2.61 | 2.1 | 2.03 | 3.2 | 3.42 | 3.25 | 3.42 | 3.77 | 3.82 | 3.49 | 3.49 | 3.59 | 3.78 | 3.98 | 4.34 | 5.19 | 5.94 | 4.74 | 5.98 | 6.47 |
| MICROCHIP TECHNOLOGY INC | 93.06 | 2021 | x | x | 0.02 | 0.0565 | 0.104 | 0.285 | 0.4825 | 0.6025 | 0.673 | 0.6795 | 0.687 | 0.695 | 0.703 | 0.7085 | 0.7125 | 0.7165 | 0.7205 | 0.7245 | 0.7285 | 0.7325 | 0.747 | 0.98 | 1.12 | 1.12 | 0.32 | 0.37 | 0.535 | 0.635 | 0.74 | 0.785 | 0.635 | 0.66 | 1.175 | 0.945 | 0.945 | 1.225 | 1.33 | 1.34 | 1.995 | 2.725 | 3.105 | 2.81 | 3.295 | 2.09 | 2.59 | 2.77 |
| MONCLER SPA | 59.30 | 2021 | x | x | x | x | x | x | x | x | x | x | x | x | x | 0.1 | 0.12 | 0.14 | 0.18 | 0.28 | 0.4 | 0 | 0.45 | 0.55 | 0.67 | 0.75 | x | x | x | x | x | x | x | x | x | x | x | 0.3 | 0.52 | 0.67 | 0.78 | 0.98 | 1.31 | 1.43 | 1.18 | 1.41 | 1.77 | 2.03 |
| NORTHROP GRUMMAN CORP | 404.50 | 2021 | 0.8 | 0.8 | 0.8 | 0.8 | 0.89 | 1.01 | 1.16 | 1.48 | 1.57 | 1.69 | 1.84 | 1.97 | 2.15 | 2.38 | 2.71 | 3.1 | 3.5 | 3.9 | 4.7 | 5.16 | 5.67 | 6.16 | 6.72 | 7.36 | 0.17 | 2.32 | 2.97 | 3.85 | 4.37 | 5.12 | -3.77 | 5.21 | 6.82 | 7.52 | 7.47 | 7.88 | 8.93 | 9.21 | 14.59 | 14.04 | 21.33 | 21.21 | 23.65 | 31.7 | 25.7 | 29.4 |
| NOVARTIS AG | 93.517 | 2021 | 0.85 | 0.9 | 0.95 | 1 | 1.05 | 1.15 | 1.35 | 1.6 | 2 | 2.1 | 2.2 | 2.25 | 2.3 | 2.45 | 2.6 | 2.7 | 2.75 | 2.8 | 2.85 | 2.95 | 3 | 3.02205225 | 3.11446975 | 3.253096 | 1.89 | 1.97 | 2.27 | 2.62 | 3.04 | 5.13 | 4.18 | 4.5 | 5.15 | 5.5 | 5.15 | 5.09 | 5.23 | 4.9 | 4.75 | 4.86 | 5.15 | 5.4 | 5.78 | 4.18651275 | 4.57466625 | 5.05523725 |
| ONEOK INC | 57.48 | 2021 | 0.31 | 0.31 | 0.31 | 0.345 | 0.44 | 0.545 | 0.61 | 0.7 | 0.78 | 0.82 | 0.91 | 1.08 | 1.27 | 1.48 | 2.125 | 2.43 | 2.46 | 2.72 | 3.245 | 3.53 | 3.74 | 3.74 | 3.76 | 3.79 | 0.695 | 0.61 | 1.15 | 2.53 | 1.34 | 1.395 | 1.475 | 1.435 | 1.55 | 1.68 | 1.71 | 1.27 | 2.963833212 | 3.050787791 | 3.220794968 | 3.656199189 | 4.430486936 | 4.88353037 | 4.383960294 | 3.3 | 3.63 | 3.82 |
| ORGANON & CO ORDINARY SHARES | 41.44 | 2021 | x | x | x | x | x | x | x | x | x | x | x | x | x | x | x | x | x | x | x | x | x | 0.56 | 1.27 | 1.28 | x | x | x | x | x | x | x | x | x | x | x | x | x | x | x | x | x | x | x | 5.85 | 7.69 | 5.63 |
| PHILIP MORRIS INTERNATIONAL INC | 111.25 | 2021 | x | x | x | x | x | x | x | x | 1.54 | 2.24 | 2.44 | 2.82 | 3.24 | 3.58 | 3.88 | 4.04 | 4.12 | 4.22 | 4.49 | 4.62 | 4.74 | 4.9 | 5.11 | 5.51 | x | x | x | x | x | x | 3.31 | 3.29 | 3.87 | 4.88 | 5.22 | 5.4 | 5.02 | 4.42 | 4.48 | 4.72 | 5.1 | 5.19 | 5.17 | 5.88 | 6.63 | 7.2 |
| POLARIS INC | 154.64 | 2021 | 0.22 | 0.25 | 0.28 | 0.31 | 0.46 | 0.56 | 0.62 | 0.68 | 0.76 | 0.78 | 0.8 | 0.9 | 1.48 | 1.68 | 1.92 | 2.12 | 2.2 | 2.32 | 2.4 | 2.44 | 2.48 | 2.52 | 2.61 | 2.84 | 1.06 | 1.19 | 1.125 | 1.56 | 1.29 | 1.535 | 1.75 | 1.525 | 2.14 | 3.2 | 4.4 | 5.35 | 6.65 | 6.75 | 3.48 | 5.1 | 6.56 | 6.32 | 7.74 | 9.02 | 9.96 | 9.72 |
| RAYTHEON TECHNOLOGIES CORP | 101.76 | 2021 | x | x | x | x | x | x | x | x | x | x | x | x | x | x | x | x | x | x | x | x | 1.425 | 2.005 | 2.13 | 2.28 | x | x | x | x | x | x | x | x | x | x | x | x | x | x | x | x | x | x | 2.73 | 2.99 | 4.47 | 5.34 |
| RECKITT BENCKISER GROUP PLC | 7,010.10 | 2021 | 25.5 | 25.5 | 25.5 | 28 | 34 | 39 | 45.5 | 55 | 80 | 100 | 115 | 125 | 134 | 137 | 139 | 139 | 153.2 | 164.3 | 170.7 | 174.6 | 174.6 | 175 | 175 | 175 | 55.7 | 66.2 | 77.1 | 90 | 107.1 | 123.4 | 157.8 | 194.7 | 226.5 | 247.1 | 263.3 | 269.8 | 268.5 | 258.6 | 302 | 324.6 | 339.6 | 349 | 327 | -106 | 304 | 325 |
| RED ELECTRICA CORPORACION SA | 16.21 | 2021 | 0.10375 | 0.11375 | 0.12 | 0.137 | 0.15345 | 0.1826 | 0.2246 | 0.271775 | 0.319925 | 0.369525 | 0.468775 | 0.5531 | 0.591275 | 0.63555 | 0.75 | 0.8025 | 0.8587 | 0.9188 | 0.9831 | 1.0519 | 1 | 1 | 1 | 0.92 | 0.185 | 0.215 | 0.2525 | 0.3 | 0.37 | 0.4525 | 0.53 | 0.6125 | 0.725 | 0.855 | 0.915 | 0.98 | 1.3275 | 1.1225 | 1.18 | 1.24 | 1.31 | 1.33 | 1.15 | 1.26 | 1.27 | 1.26 |
| RESTAURANT BRANDS INTERNATIONAL INC | 75.37 | 2021 | x | x | x | x | x | x | x | x | x | x | x | x | x | x | x | 0.44 | 0.62 | 0.78 | 1.8 | 2 | 2.08 | 2.12 | 2.26 | 2.43 | x | x | x | x | x | x | x | x | x | x | x | x | 0.98 | 1.09 | 1.58 | 2.1 | 2.63 | 2.72 | 2.03 | 2.77 | 3.14 | 3.46 |
| ROSS STORES INC | 139.15 | 2021 | 0.019375 | 0.021875 | 0.025 | 0.0321875 | 0.044375 | 0.055 | 0.06375 | 0.08 | 0.09875 | 0.1225 | 0.175 | 0.235 | 0.295 | 0.255 | 0.4 | 0.47 | 0.54 | 0.64 | 0.9 | 1.02 | 0.285 | 1.15 | 1.29 | 2.04 | 0.3125 | 0.3675 | 0.2825 | 0.34 | 0.425 | 0.475 | 0.5825 | 0.885 | 1.1575 | 1.43 | 1.765 | 1.94 | 2.21 | 2.51 | 2.83 | 3.55 | 4.26 | 4.6 | 0.24 | 4.53 | 5.38 | 5.92 |
| SANOFI SA | 104.78 | 2021 | 0.44 | 0.66 | 0.84 | 1.02 | 1.2 | 1.52 | 1.75 | 2.07 | 2.2 | 2.4 | 2.5 | 2.65 | 2.77 | 2.8 | 2.85 | 2.93 | 2.96 | 3.03 | 3.07 | 3.15 | 3.2 | 3.29 | 3.47 | 3.6 | 2.42 | 2.95 | 3.88 | 4.74 | 5.23 | 5.24 | 5.59 | 6.61 | 7.06 | 6.62 | 6.14 | 5.05 | 5.2 | 5.64 | 5.68 | 5.52 | 5.47 | 5.99 | 5.86 | 4.77 | 5.7 | 6.27 |
| ST JAMES’S PLACE PLC | 1,645.40 | 2021 | 2.25 | 2.75 | 2.75 | 2.75 | 2.85 | 3.15 | 10 | 4.3 | 4.39 | 4.5 | 6 | 8 | 10.64 | 15.96 | 23.3 | 27.96 | 33 | 42.86 | 48.22 | 49.71 | 38.49 | 50 | 57 | 64 | -5.9 | 1.5 | 2.6 | 8.2 | 16.9 | 16.1 | 14.1 | 8.2 | 11.2 | 21.2 | 21.2 | 27 | 33.2 | 34.2 | 37.9 | 52.7 | 57.8 | 51.1 | 49.1 | 56 | 68 | 79 |
| STANLEY BLACK & DECKER INC | 236.36 | 2021 | 0.9 | 0.94 | 0.99 | 1.03 | 1.08 | 1.14 | 1.18 | 1.22 | 1.26 | 1.3 | 1.34 | 1.64 | 1.8 | 1.98 | 2.04 | 2.14 | 2.26 | 2.42 | 2.58 | 2.7 | 2.78 | 2.98 | 3.16 | 3.35 | 2.1 | 1.27 | 4.36 | 3.16 | 3.46 | 3.95 | 3.84 | 2.79 | 3.54 | 4.65 | 4.72 | 4.98 | 5.67 | 5.92 | 6.53 | 7.46 | 8.15 | 8.4 | 9.04 | 11 | 12.2 | 13.2 |
| STARBUCKS CORP | 129.85 | 2021 | x | x | x | x | x | x | x | x | x | x | 0.18 | 0.28 | 0.36 | 0.445 | 0.55 | 0.68 | 0.85 | 1.05 | 1.32 | 1.49 | 1.68 | 1.84 | 1.96 | 2.19 | 0.13 | 0.165 | 0.235 | 0.305 | 0.355 | 0.435 | 0.355 | 0.4 | 0.615 | 0.76 | 0.895 | 1.095 | 1.33 | 1.58 | 1.85 | 2.06 | 2.42 | 2.83 | 1.17 | 3.09 | 3.64 | 4.12 |
| TENCENT HOLDINGS LTD | 645.94 | 2021 | x | x | x | x | 0.014 | 0.016 | 0.024 | 0.032 | 0.07 | 0.08 | 0.11 | 0.15 | 0.2 | 0.24 | 0.36 | 0.47 | 0.61 | 0.88 | 1 | 1.2 | 1.6 | 1.936485072 | 2.118030548 | 2.517430594 | x | 0.0488 | 0.0568 | 0.0534 | 0.117 | 0.1706 | 0.3028 | 0.5582 | 0.8656 | 1.098 | 1.3666 | 1.6596 | 2.589 | 3.437 | 4.784 | 6.83 | 8.097 | 9.729 | 12.689 | 18.63866882 | 20.33309326 | 24.44812403 |
| TEXAS INSTRUMENTS INC | 204.96 | 2021 | 0.085 | 0.085 | 0.085 | 0.085 | 0.08875 | 0.105 | 0.13 | 0.3 | 0.41 | 0.45 | 0.49 | 0.56 | 0.72 | 1.07 | 1.24 | 1.4 | 1.64 | 2.12 | 2.63 | 3.21 | 3.72 | 4.21 | 4.59 | 4.98 | -0.2 | 0.68 | 1.05 | 1.39 | 2.78 | 1.83 | 1.44 | 1.15 | 2.62 | 1.88 | 1.51 | 1.91 | 2.57 | 2.82 | 3.48 | 3.61 | 5.59 | 5.24 | 5.97 | 7.9 | 8.18 | 8.47 |
| THE HOME DEPOT INC | 347.68 | 2021 | 0.16 | 0.17 | 0.21 | 0.26 | 0.325 | 0.4 | 0.675 | 0.9 | 0.9 | 0.9 | 0.945 | 1.04 | 1.16 | 1.56 | 1.88 | 2.36 | 2.76 | 3.56 | 4.12 | 5.44 | 6 | 6.6 | 7.15 | 7.61 | 1.56 | 1.88 | 2.26 | 2.72 | 2.79 | 2.37 | 1.34 | 1.57 | 2.01 | 2.47 | 3 | 3.76 | 4.71 | 5.46 | 6.45 | 7.29 | 9.73 | 10.25 | 11.94 | 14.6 | 15.1 | 16 |
| TJX COMPANIES INC | 83.50 | 2021 | 0.02 | 0.0225 | 0.03 | 0.035 | 0.045 | 0.06 | 0.07 | 0.09 | 0.11 | 0.12 | 0.15 | 0.19 | 0.23 | 0.29 | 0.35 | 0.42 | 0.52 | 0.625 | 0.78 | 0.92 | 0.26 | 1.04 | 1.16 | 1.29 | 0.245 | 0.29 | 0.3025 | 0.3525 | 0.3875 | 0.415 | 0.5 | 0.71 | 0.825 | 0.965 | 1.275 | 1.47 | 1.575 | 1.665 | 1.73 | 2.02 | 2.43 | 2.67 | 0.07 | 2.81 | 3.34 | 3.71 |
| UNILEVER PLC | 52.115 | 2021 | 0.4766666667 | 0.5366666667 | 0.5666666667 | 0.58 | 0.63 | 0.66 | 0.96 | 0.75 | 0.77 | 0.465 | 0.832 | 0.9 | 0.972 | 1.076 | 1.14 | 1.208 | 1.2804 | 1.434 | 1.5488 | 1.6416 | 1.658 | 1.7085785 | 1.7792783 | 1.885328 | 0.6933333333 | 0.9133333333 | 0.86 | 1.19 | 1.52 | 1.23 | 1.68 | 1.16 | 1.31 | 1.37 | 1.53 | 1.69 | 1.73 | 1.93 | 2.03 | 2.23 | 2.35 | 2.55 | 2.48 | 2.2270437 | 2.4037932 | 2.6630258 |
| UNITEDHEALTH GROUP INC | 459.20 | 2021 | 0.00375 | 0.0075 | 0.0075 | 0.0075 | 0.015 | 0.015 | 0.03 | 0.03 | 0.03 | 0.03 | 0.405 | 0.6125 | 0.8 | 1.0525 | 1.405 | 1.875 | 2.375 | 2.875 | 3.45 | 4.14 | 4.83 | 5.6 | 5.8 | 6.23 | 0.95 | 1.34 | 1.83 | 2.31 | 2.97 | 3.42 | 2.4 | 3.24 | 4.1 | 4.73 | 5.28 | 5.83 | 6.04 | 6.45 | 8.05 | 10.07 | 12.88 | 15.11 | 16.88 | 17.9 | 20.6 | 23.4 |
| VF CORP | 91.18 | 2021 | x | x | x | x | x | x | x | x | x | x | x | x | x | x | x | x | x | x | x | 1.39 | 1.94 | 1.97 | 2.04 | 2.09 | x | x | x | x | x | x | x | x | x | x | x | x | x | x | x | x | x | 1.7 | 1.04 | 3.41 | 3.73 | 4.25 |
| WESTERN MIDSTREAM PARTNERS LP | 24.93 | 2021 | x | x | x | x | x | x | x | x | x | x | x | x | 0.03587 | 0.82125 | 1.125 | 1.49125 | 1.7675 | 2.105 | 2.34875 | 2.47 | 1.244 | 1.29 | 1.36 | 1.43 | x | x | x | x | x | x | x | x | x | x | 0.03587091587 | 0.8210794167 | 1.128153122 | 1.493867427 | 1.753871242 | 2.107960956 | 2.344534476 | 3.187744412 | 2.817329195 | 2.24 | 2.63 | 2.85 |
14 Me gusta
Vash ha invertido en China. ![]()
![]()
![]()
Y ya casi tiene 60 posiciones en la cartera.

3 Me gusta
En breve tendre 500 ![]()
3 Me gusta
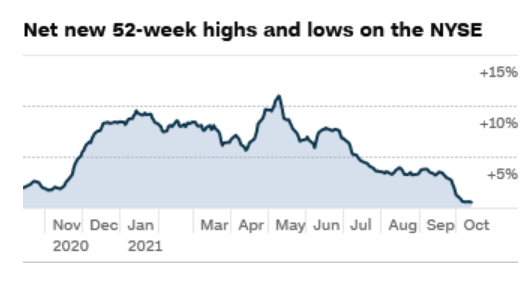
Una grafica sorprendente para un indice que no deja de batir maximos
No es igual, es mas importante
Cuando viene una gorda, y todo baja, tener unos ingresos pasivos que aunque bajen, no en la misma proporcion te da mucha tranquilidad y evita hacer tonterias
Al menos es mi expericiencia.
70% acciones, 30 cash, 0 fondos (Solo el PP de Bestinver)
2 Me gusta
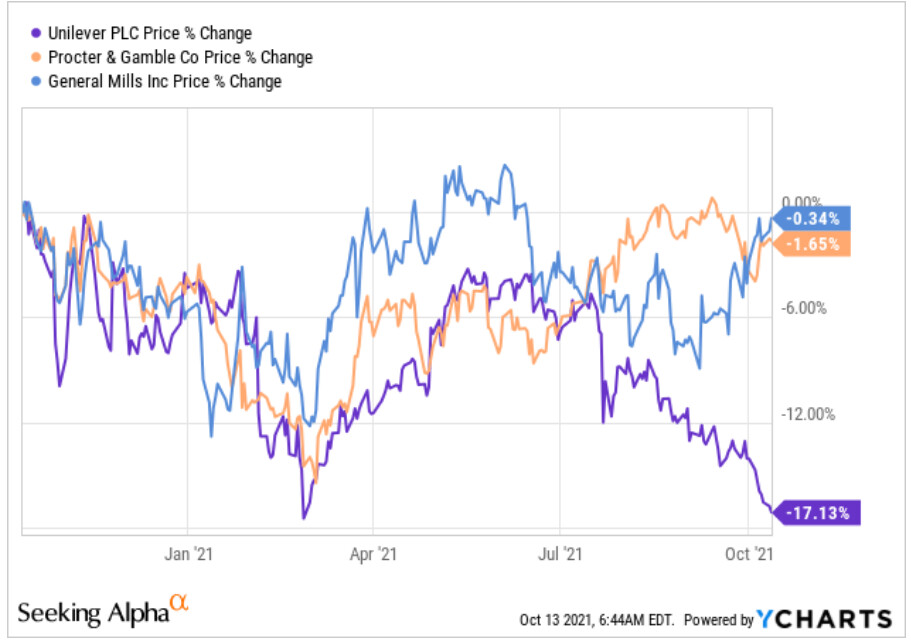
Las consumer staples europeas se estan dejando los higadillos este año, no se si es la inflacion, si es que tienen peores marcas que las americanas y no tienen pricing power, si es que en Europa no tenemos un duro y solo compramos marca blanca o que pero asi es … ¿oportunidad de compra o trampa de valor?
4 Me gusta
No la veo peor empresa que las otras 2. Me gustaría decir que oportunidad que yo estoy comprando estos meses
1 me gusta
Yo me estoy poniendo fino a comprar Unilever.No le veo carencias en comparación con las grandes americanas.
¿Otro jamon en ciernes? ![]()
![]()
Quizás habría que preguntarse si el comportamiento en Bolsa de esas consumer staples europeas en los últimos 9 meses tiene alguna relación con los fundamentales presentados, o simplemente tiene relación con los flujos de dinero que entran en el SP500 y como les esta sirviendo para mantenerse en el YTD, o quizás puramente con cambios en las divisas.
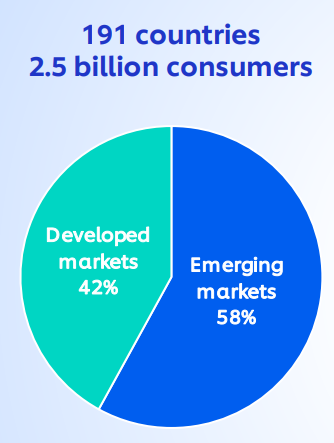
Ya que tomando el ejemplo de Unilever, europea es, pero su primer mercado es USA con un 18% de las revenues y los mercados emergentes pesan más que los desarrollados:
El tema es que lo que pasa en 9 meses con la cotización probablemente no tenga nada que ver con los fundamentales del negocio subyacente.
5 Me gusta
Gente que se indexa al SP500 ¡Yo os maldigo!
Quiza el mix de ventas sea una explicacion
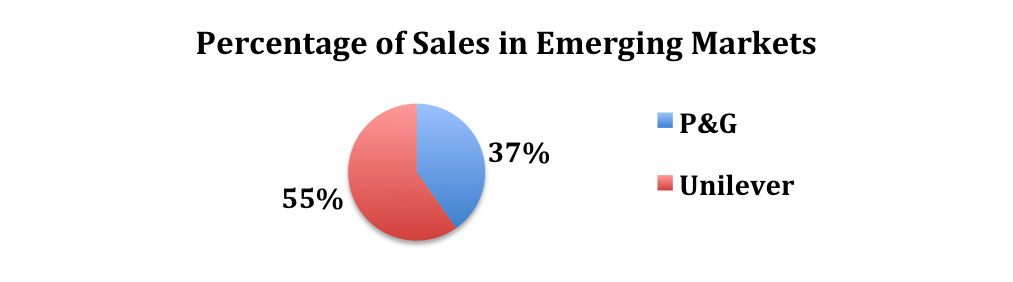
¿Estan los emergentes mas amenazados por la inflacion?
2 Me gusta
¿Este gráfico lo hizo un político en campaña electoral? ![]()
5 Me gusta
Me ha hecho gracia pero el grafico esta bien. Encuentra la explicacion 
2 Me gusta
No tengo ni idea Vash, pero el gran momento para comprar PG fue cuando precisamente estaba cercana al 4% de RPD y había una nube de dudas. Casi un 100% desde entonces.
Viendo tu tabla, ¿nunca te planteaste introducir algo como FCF/share o FCF yield para poder comprar empresas que no reparten dividendo? Lo digo porque realmente el dividendo que te pueden aportar Activision Blizzard o Tencent por ejemplo con un 0 y pico %, en la práctica va a ser igual a una empresa que no reparta. ¿Por qué ATVI o Tencent y no TTWO?
Si, la cuenta de dividend yield + growth yield = 15% me la conozco pero no se, el tema de comprar empresas con dividendo de 0.X% pero no empresas con dividendo 0% es de esas cosas que me pregunto si de verdad tienen sentido. Cuando el yield inicial es de un 2% hacia arriba pues vale, los euros entrando en cuenta ya tienen cierto volumen, pero en 0 y pico apenas.
6 Me gusta
Yo tampoco
PG hizo una reorganizacion vendiendo cientos de marcas irrelevantes y quedandose solo con las top tier. Una vez mas el managment usano dando sopas con honda al britanico y europeo.
Unilever si no llega a ser porque se pusieron algo las pilas cuando Kraft intento comprarles a saber donde estaria. Pero parece que ya se les ha pasado el susto.
Me corto ya las venas sacando los historicos de EPS, donde unas usan el GAAP earnings, otras el NON GAAP, otras el core earnings, adjusted, diluted, earnings from continuing operations, el FFO, AFFO, DCF, de verdad que a veces pienso en mandarlo todo a la M …
y lo mejor es que algunas lo van cambiando segun pasan los años para ajustarse mejor a la imagen real o para mejorar la comparabilidad de los resultados o por cualquier motivo que se les ocurra
Tencent mejor que BABA por el ROIC segun Terry Smith
ATVI mejor que EA o TTWO por el margen
En realidad yo que se ![]()
En realidad este viaje empezo en 2010 usando lo del DGI para filtrar empresas y descartando de partida las que no pagaban dividendos. Luego con Amazon, Facebook y Google todo esta estrategia se ha ido por el retrete. Supongo que ha sido no saber adaptarse al mundo moderno.
Al final lo mejor es tener todas en un fondo indice de bajas comisiones y no pensar en nada mas que en ver El Juego del Calamar ![]()
4 Me gusta
Quizás no sea tarde para subirse al tren. Ya ves, según M* están baratitas
Tampoco es tarde para que empiecen a pagar dividendo ![]()
Mi opinion es que si una empresa de 2 trillones de dolares puede seguir aumentando beneficios al 30% anual y nadie puede competir con ella es que algo falla. No se trata de que sean mas guapos o listos que el resto.
En un mundo donde sobra capital (y el capital siempre va alli donde hay beneficios extraordinarios) si esta anomalia no se corrige por si sola quiere decir que estamos ante un fallo del sistema capitalista y que hemos entrado en el reino de los monopolios y si la teoria tradicional de los monopolios no encaja es que esa teoria se ha quedado obsoleta para entender y valorar el efecto red tecnologico o lo que sea.
La teoria nos dice que si la publicidad en internet da miles de millones de beneficio todo el capital deberia ir a competir en ese sector hasta que el beneficio de la publicidad en internet fuese el mismo que el de cualquier otro sector. Si eso no pasa algo falla.
Los reguladores son unos boomers que no se han enterado de nada o que iban largos en las FAANGs (como ya se ha demostrado cuando han salido extractos de la Pelosi y compañia) o al gobierno USA le interesa tener a sus campeones tecnologicos metidos en todas las empresas y casas del resto del mundo (salvo China).
Los chinos no son tontos, los unicos negocios donde no dejan competir a los extranjeros es en tecnologicas con efecto red y en tabaco.
Aunque mi opinion no vale para nada. Mejor indexarse. Ya sabes, si no puedes con ellos unete a ellos ![]()
Y esta ha sido mi rant de hoy al nivel de las que lia Michael Burry en twitter ![]()
21 Me gusta