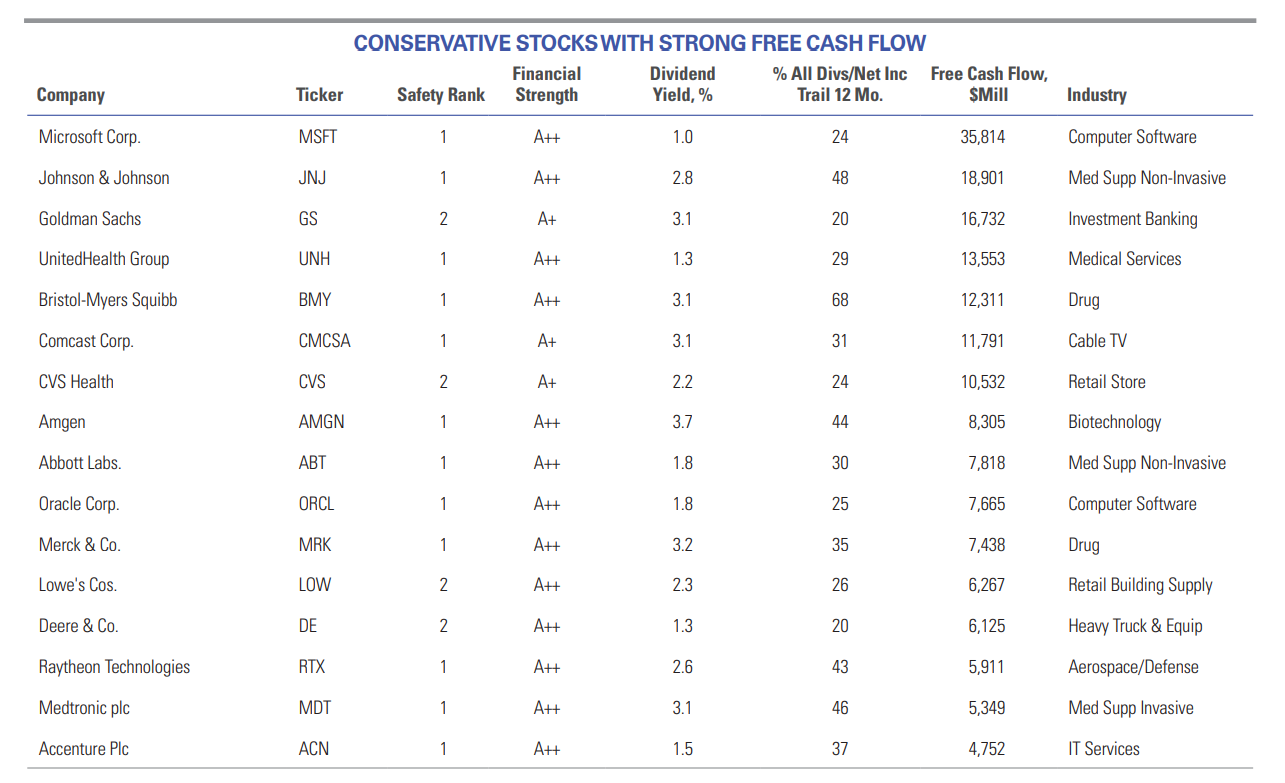
The equity markets have endured several painful selloffs so far in 2022. In such turbulent times, investors might want to put an increased emphasis on selecting conservative stocks for their portfolios. Those so inclined may wish to focus on the shares of companies that possess strong balance sheets and the ability to pay dividends, while generating healthy free cash flow.
With this in mind, we used the Stock Screener function on ValueLine.com to identify a group of stocks that possess these attributes. First, we limited the field to the shares of companies with a Financial Strength rating of A or better. Our ratings run from C for companies facing significant financial challenges to A++ for those with rock-solid balance sheets. We also required a Safety rank of 2 (Above Average) or better. These stocks, in our opinion, have less than normal total risk.
Next, we required that companies pay at least a modest dividend (providing a yield of 1.0% or higher for the purposes of this screen) and that these payouts amounted to no more 75% of profits. (Note that data is based on stock prices as of September 14, 2022.) Finally, we focused on those companies that generate considerable free cash flow, which can be put to use in a variety of ways, including increasing the dividend, buying back shares, or making strategic acquisitions. The 16 companies that scored best for this criteria are listed below. As might be expected, given the ongoing global struggle with COVID-19, drug and health-related companies are well represented in this particular screen. The group, though, also includes selections from a number of other industries. We advise investors to consult the most recent stock analyses in Ratings & Reports before investing in any of these issues.
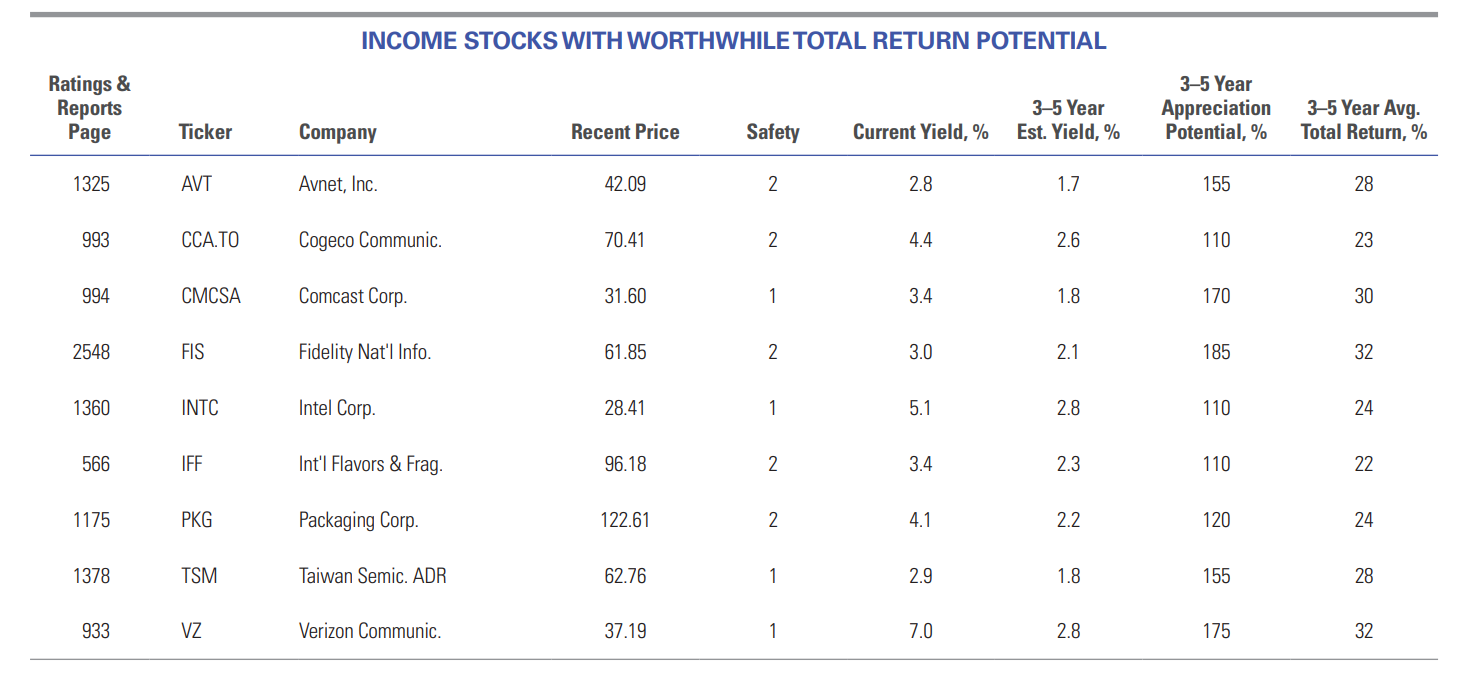
This screen focuses on stocks with good current dividend yields that have favorable prospects for relative price performance over the next three to five years. This combination should result in a group of stocks with worthwhile total return potential.
In the first steps of the selection process, we limited the field to equities with Safety ranks of at least 2 (Above Average). Next, we pared our universe with respect to income generation. We selected issues with current dividend yields of at least 2.7%, 50 basis points (0.5%) above the current median of 2.2% for all dividendpaying stocks under Value Line’s review. We then required that equities with three- to five-year projected price appreciation of less than 100% be cast aside (the current median is 70%). From this group, we selected issues with a projected average annual total return to 2025-2027 (price gains plus dividends) of at least 21%.
Conservative investors seeking good current income, along with worthwhile, risk-adjusted three- to five-year total return potential, may find these equities of interest. That said, this roster includes stocks from a range of industries, so further research is most likely warranted. To this point, economic growth may be uneven in the quarters ahead, as inflationary pressures and disruptive supply chains take a toll. Accordingly, we encourage subscribers to take this into consideration when contemplating a new commitment here.
He investigado un poco y con la e-tarjeta de la biblioteca de columbus se puede acceder a esto tmb. En research, value line, dashboard y en el quick links “Selection & Opinion”.
Fijaos en una cosa del Value Line: Cuando digo que se mojan, me refiero a que se mojan. Poir ejemplo con Medtronic.
En M* te dicen que wide moat, que 5 estrellas, que medium uncertaninty. Puedes leer el análisis. le han bajado un poco el fair value. Tiene buena pinta, pero como otras tantas.
En VL, literalmente: Investors appear unnerved, and the stock is down roughly 7% in value since our August report. Persistent macroeconomic challenges are cause for concern, in our view. Indeed, supply-chain disruptions have partly caused a decline in volumes in all of Medtronic’s operating segments. Also, foreign currency losses have dampened top-line contributions. However, the recent stock-price decline may offer conservative investors a solid buying opportunity.
Medtronic stock is worthy of investment consideration. These shares are favorably ranked for Timeliness and possess decent capital appreciation potential out to 2025-2027. The dividend yield is above the Value Line median, as well.
VL nos presenta de forma resumida en una hoja el gráfico, los resultados más importantes (ventas beneficios, cash flow, dividendos, márgenes) de los últimos 15 años y las estimaciones para los siguientes. Información sobre la estructura de capital y la deuda. Y un resumen muy breve con lo más importante, mojándose bastante.
Cada vez me gusta más el VL. Tener acceso a estos dos servicios gratuitamente es un lujazo.
Value Line Safety Rank is actually an average of two other Value Line metrics: the Value Line Financial Strength rating and Value Line’s Price Stability Index.
No. Safety estaría más relacionado con Uncertanty y el Moat. Cuando dan un rango para los próximos 3 - 5 años cuanto menos safety tiene más ancho es el rango. Lo definen así:
The SafetyTM Rank measures the total risk of a stock relative to the approximately 1,700 other stocks covered in The Value Line Investment Survey®.
Por otro lado, el Financial Strength es una medida realiva de la “salud” financiera y tiene en cuenta el balance, los ingresos y todas esas gaitas:
Financial Strength Rating: Value Line classifies 1,700 companies’ Financial Strength ratings from A++ to C, in nine steps. The lowest grade is reserved for companies experiencing serious financial difficulty. Balance sheet leverage, business risk, the level and direction of profits, cash flow, earned returns, cash, corporate size, and stock price, all contribute to a company’s relative position on the scale. The amount of cash on hand, net of debt, is also an important consideration.
Normalmente cuanto mejor es el safety, mayor capacidad de generar beneficios y por tanto mejor es el FS, aunque no tendría por qué si la empresa está muy apalancada por ejemplo. LULU tiene safety 3 y FS A++ probablemente a que tiene 0 deuda, caja neta y se gestiona de forma conservadora.
Una duda que llevo un tiempo teniendo. ¿No debería haber correlación entre VL Financial Strength, M* Financial Health y no sé si el S&P Credit Rating? En la CQSS veo a veces cosas muy dispares, ¿os ha dado alguna vez por hacer algo de análisis multivariante y ver alguna correlación?
No, en serio, S&P, Moody’s y de más califican la deuda. La empresa les paga para que les den una calificación crediticia. En base a esa calificación los bonos emitidos pagarán el interés. Se supone que tienen acceso a más datos de dentro de la empresa, y se les asume cierto rigor.
VL da su calificación en base a la info conocida y su distribución parece seguir una normal (campana de Gauss) con la mayoría en el entorno al B+ y B. Pocas puntúan A++ pero también pocas puntúan C.
Y M* no sabría decirte, solo da 5 niveles A, B, C, D y F y seguramente se basa también en parámetros cuantitativos y las evalúa de forma relativa.
Seguramente hay una correlación fuerte entre todas, pero no tendrían porqué coincidir.
He pensado alguna vez en volcarme los datos y sacar algo, pero se me pasa rápido (y mira que creo que tardo más en escribir este post). Igual he encendido una mecha
Lo pensé por incluso descartar algunas empresas como outliers si sacaba una covarianza del total y quedaban alejadas de la distribución.
Cuando te refieres a como sacarlo a que te refieres exactamente? Esta en los PDFs y puedes usar Tabula que es un una herramienta para leer tablas de PDF.
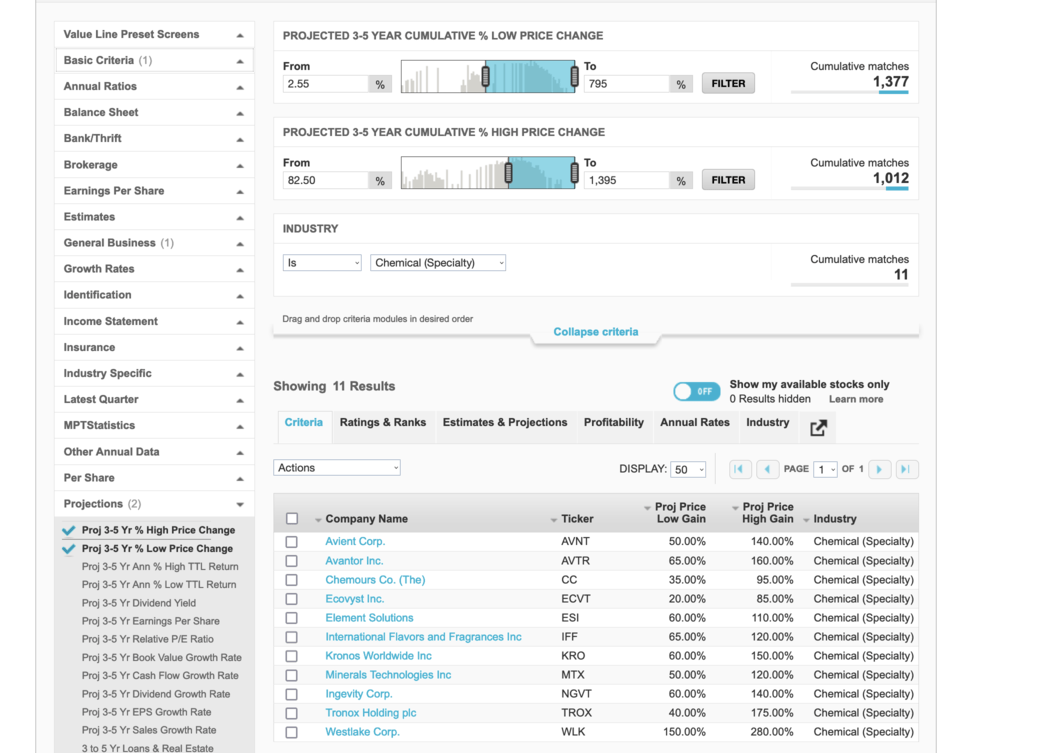
Si preguntas como usarlo en los filtros del screener, creo que tienes que, una vez en el screener:
cerrar el “Basic Criteria”
Ir hacia abajo y abrir “Projections”
Ahi puedes seleccionar “Proj. 3-5 Yr % High Price Change” (o Low lo que prefieras).
Luego para verlo el la sección de los resultados, selecciona la pestaña de “Criteria”. Asegurate que los filtros estos están “primeros” (los puedes arrastrar hacia arriba).
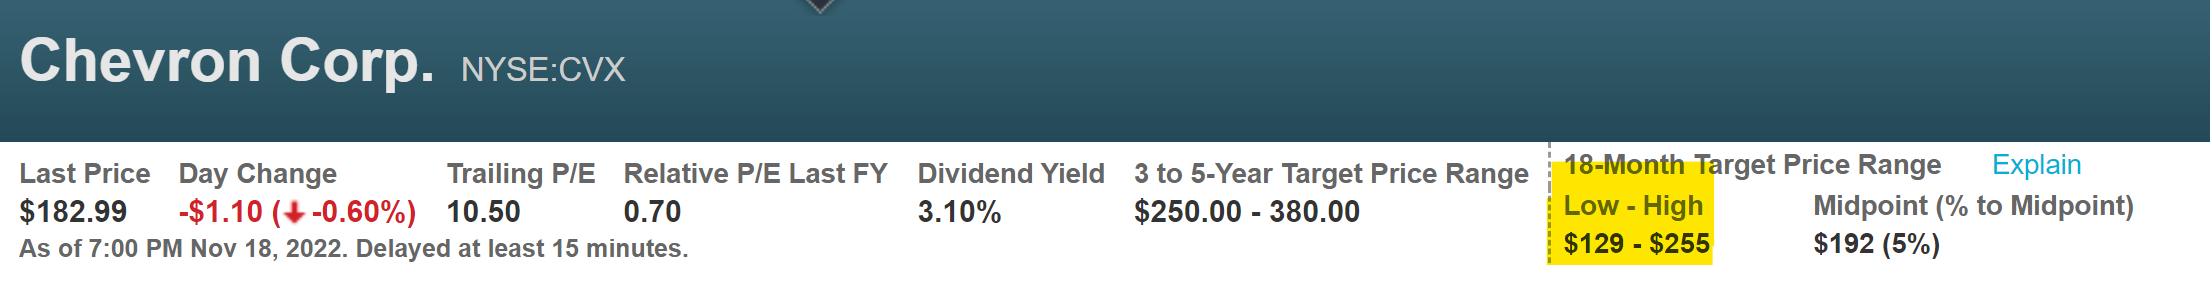
VL’s 18-Month Target Price Range (TPR) seeks to predict a stock’s price over an 18-month horizon (from the present) in terms of a range. In addition to the high and low values of the range, the percentage difference between the recent stock price and the midpoint of the range is provided.
The percentage may be thought of as the most likely potential profit. The larger the percentage, the greater the possible price appreciation. The quantitative formula behind the 18-month range includes a number of variables, such as our analyst estimates and historical figures.