“**There are three primary ways to calculate returns: **
(1) price change (aka capital appreciation); (2) price change + dividends; (3) price change + dividends + dividend reinvestment.
Each has its uses. The most common method, by far, is price (alone). That’s what practically all charts show. The most common comparisons on TV, in articles and videos, etc. are price-only comparisons. Comparisons to benchmarks (like the S&P 500) are almost always price-only comparisons. The talking head on TV might add, “…plus the dividends, of course…” , but they are not often shown.
When you see a statement like, “Over many years, dividends have provided 40% of stock returns,” that’s #2: price + dividends. (For 1950-2020, the contribution of dividends is 42%). To be more specific, it should say annual returns, because re-investing dividends or not makes relatively little difference in just a single year. (Source: am.jpmorgan.com/…)
When you see a statement like, “Over many years, dividends are responsible for 80% of stock returns,” or any number over 50%, that’s #3: price change + dividends + dividends reinvested. The compounding of dividends by reinvesting them curves upward over the years, so if you have a long-enough timeframe, the contribution of dividends ranges toward 90% or above if they have been reinvested along the way.
Many sources (and article writers, and video makers, and talking heads on TV) say “total” return” without specifying what they are referring to. I hate that, because it makes a difference. The more years are in the timeframe, the bigger difference it makes.
I don’t consider dividends to be “new money,” because the portfolio generates them. In accumulation, they’re not being extracted, so the portfolio’s returns all come from within the portfolio. To make that clear when I write, I specify “no new outside money,” because I know that some (many?) people do consider dividends to be new money.
I just think the best practice is to be explicit about which returns one is talking about, but it is not very common to do so. Yet people make comparisons that may become distorted, because two different sets of “total returns” are being calculated differently, but nobody notices that oranges are being compared to apples.
Dave"
Buenas, en mi caso particular mido el rendimiento logrado incluyendo dividendos, pero dado que invierto mas de lo que me genera la cartera no me complico mucho con las cifras, considero la cifra total invertida a fecha de hoy mas dividendos del año mas resultado de ventas y la comparo con el valor total actual de la cartera.
"This entire discussion is using total return as the measuring stick for "beating the market."
But this is a DG blog. I would expect the measuring stick to be DG statistics. If you use those, probably most of the people here are beating the market, have beaten the crap out of the market for the past several years (or even decades), and will continue to beat the market in the years ahead.
I know that I have. Then – as a side benefit – I have also amassed more wealth than I ever thought I could or would. The reasons for that are explained in Mike’s tweet: " It also helped make me more disciplined and less concerned about price movement. It restored my confidence and made me unafraid of the market’s ebbs and flows."
In other words, being successful at DGI meant that I stayed in the market all these years. Not 50-50 or 60-40, but more like 90-10. If you look at practically any stats about how “average investors” do, they trail almost every asset category that exists. The reason? They don’t stay in the market. Or they divide up their holdings 50-50 or 60-40 for (perceived) safety.
So while it’s true that had I simply invested in the S&P500 back in 2008 and stuck it out, I would have more unrealized gains than I do now, the chances that I would be that 1-in-1000 guy that ACTUALLY DOES IT are small. The fact is, it’s not easy to be a buy-and-hold index investor with all of your assets for years on end.
And, from my numbers, the market only passed my unrealized gains after the pandemic crash last year. Until then, I was beating the market on that metric too. Looking forward, nobody here knows whether that relationship will hold up or fold up in the next 12-18-24 months.
But while I’m not 100% certain, I would bet – indeed I am betting – that over the same time frames, I will continue to beat the crap out of the market in terms of income generated. Since that is more than enough for my wife and me to live beyond any standard that we ever contemplated when we were young, I think we’ll keep on doing it. It’s worked, and I see little reason that it won’t continue to work.
Plus it’s fun. I wouldn’t have met all you guys, for example, if we were 100% into VOO or SPY.
Dave"
Yo creo que es importante que se haya abierto este debate del total return en el mundo DGI. Muchas veces los DGI de referencia se siguen yendo por las ramas pero algo ha cambiado. Ahora ya hay debate. Antiguamente simplemente se evitaba este tema diciendo que con cobrar dividendos crecientes era suficiente.
Por ejemplo, creo que dividendmantra nunca ha puesto datos de su rendimiento, lo mismo dividendgrowthinvestor, Chowder, etc. Y creo que ningun DGI famoso lo hace. Pero muchos si ponen datos de sus dividendos y del crecimiento de los mismos. Creo que tenemos que ser honestos y saber que los indices estan ahi, que es muy facil acceder a su misma rentabilidad a traves de fondos y ETFs y que si su total return es mayor no podemos simplemente obviarlo y esconder la cabeza.
Por ejemplo, la cartera CQSS Creme de la Creme es un resultado de no cerrarnos a este debate. Indexarse individualmente a las acciones DGI del Dow Jones puede ser otra opcion. Creo que en la vida siempre es mejor afrontar todo de cara en vez de escondernos. Intentar mejorar nuestra forma de invertir cada dia es algo bueno. Espero que este debate siga mejorando nuestra forma de afrontar los mercados. Llegar a la IF no tiene porque ser el final del camino sino otro paso más en nuestro proceso continuo de mejorar como inversores.
Si que estoy de acuerdo, y tambien lo he comentado alguna vez, que quiza el DGI ayuda en el tema de ser mas disciplinado, ser capaz de invertir el 100% de tu patrimonio en la estrategia, esforzarte por ahorrar mas para comprar alguna accion extra y subir algo mas los divis anuales, etc es algo positivo de esta estrategia porque los dividendos crecientes entrando periodicamente en nuestra cuenta del banco tienen un refuerzo positivo en nuestra conducta.
Quiza con una estrategia 100% indexada seriamos capaces de ser igual de disciplinados, ahorradores, etc o quiza no y podriamos terminar siendo mas complacientes, esforzarnos menos por ahorrar o tener otros cambios en nuestro comportamiento que impactasen en el patrimonio total obtenido al final. Pero no escondamos la cabeza. Intentemos seguir mejorando a ver si batimos a los indices.
Debate en S.A de 3 días acerca de uso Benchmarks o no, de indexación o DGI y otras cosas.
Todo empezó con este post de un israelí.
La conversación fue hace 7 días por lo que debe quedarle poco hasta que la borren. Para quien quiera guardar la conversación y leerla tranquilamente.
@anbax Me ha encantado el comentario, supongo que porque me siento muy identificado, pero más que por la manera de invertir, por los diferentes aspectos de la vida de manera más general.
Con una actitud de mejorar, aunque seas muy bueno en algo, siempre vas a analizarte y abrir la mente por si hay alguna otra vía para mejorar, si no es tan bueno lo que haces, etc. Vas a escuchar opiniones diferentes, pero no para que salga por la otra oreja sino para analizarlo bien. Etc.
Cierro la temática filosófica por si empiezo a irme por las ramas😅
Ese texto, lo escribirías tú, pero @Bass te dictó algún trozo, … y lo sabes.
Soy el “negro literario” de @anbax

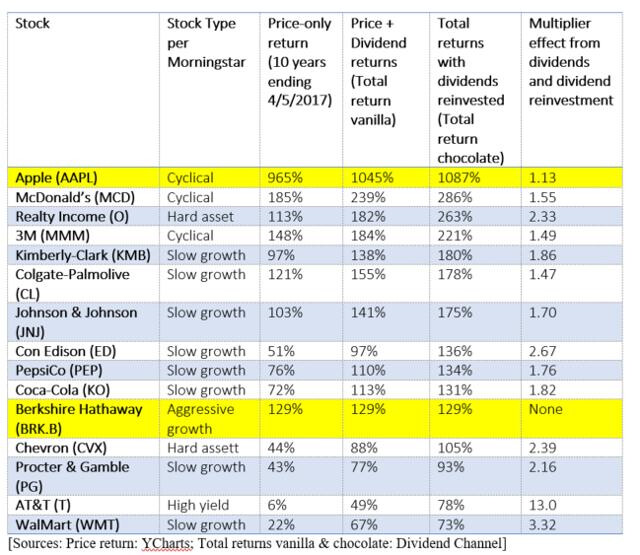
Obviously, if you choose the right growth stocks, they will in fact provide the best total returns, as the example of Apple illustrates. Every generation has its rocket ships, and no amount of dividend reinvestment will match them in total return.
But the conventional wisdom that all high-yield or slow-growth stocks deliver less total returns than aggressive growth stocks is not correct. One can build quite a nice nest egg by buying dividend growth stocks and reinvesting the dividends. Compounded over many years, such a portfolio may end up with better total returns than a “growth” portfolio.
Fully agree
Para hacernos una idea del nivel $ que tiene. A saber cuánta cantidad es el cash total.
"My wife and I retire money each year from market risk, never to return. We retired more than $100k a month or so ago.
But the rest stays in the market, generating income. I just completed our Q4 report ( did it early because we’re hitting the road on Thursday). Even with that large conversion to cash-ish, we’re 14% cash and near-cash compared to 86% DG stocks and DG ETFs. No bonds.
¿Pero cuantos gastos tiene el señor Van Knapp?
![]()
Me alegro que deje los vídeos y vuelva al formato original. TXN la tuvimos al 3,5% de yield hace poco y aún me estoy flagelando por no haber entrado.
A mi me parece un empreson. Bien gestionada, deuda súper controlada, casi inexistente, fcf, aumentos de divi de doble dígito.
Tengo una posición decente para lo que es mi cartera a PMC de 173$, pero si vuelve a rondar los 150 hay que darle.
DVK va a colaborar con SSD para escribir algunos artículos acerca de DGI.
Libre acceso.
El primero, aquí.
"I did a quick analysis of the Sector Performance chart in a very simple way: A sector gets +1 for each spot it beat the S&P 500 by in a given year, and -1 for each spot that it is below the S&P 500 in a given year. The chart is here ( novelinvestor.com/… ), and it covers 2008-2022 (I did not count 2023, too early).My rankings do not show amount of outperformance or underperformance, rather just a total count of the number of slots each sector has been above or below the S&P 500, annually, for the time period covered.Here is how the sectors ranked:
Consumer Discretionary----------+23
IT--------------------------------------- +15
Health Care--------------------------+13 (Just 3 sectors with + scores)
Financials---------------------------- -3
Consumer Staples --------------- -5
Industrials -------------------------- -7
Real Estate ------------------------ -10
Communication Services ------ -12
Utilities ------------------------------ -14
Materials---------------------------- -15
Energy------------------------------- -30
The total performance of each sector (in percentages) is available at the chart itself. Note that the S&P 500’s return for the period is listed as +8.8% annually. The chart is not labeled as to whether it is showing returns as price-only, price + dividends, or price + dividends + dividends reinvested.Dave
