Increíble análisis Marcos!! Ahora sí que ya no nos queda ninguna duda jaja! Magnífico trabajo! Ahora ya sólo nos queda en centrarnos en ahorrar e invertir!!
Brutal Marcos, increíble el análisis. Para enmarcar. Ahora solo faltan los  para meterlo todo a muerte
1 me gusta
Esta genial. Muchas gracias.
Cada vez que escribes sobre tu DCA Tunned me dijo que voy a tratar de implementarlo pero al final no lo hago. Voy a ponerme en serio este fin de semana a estudiarlo
Por cierto, acabo de colgar una noticia en el hilo de Myinvestor con préstamo para invertir que viene al pelo a tu post, aunque eso no es para mi porque no tengo tantos
1 me gusta
O me confundo los nombres, o tú no eres el que le dura el dinero en la cartera menos que un caramelo en la puerta de un colegio?
3 Me gusta
 Servidor! jajaja
Ese capital que quema es el que marco como objetivo mensual a invertir, pero eso no significa que ese sea todo mi capital disponible…
2 Me gusta
leñe, eres una caja de sorpresas, si tienes cash parado detrás “por si acaso” entonces cambia todo!
2 Me gusta
Jajajaja a ver, a ver. Maticemos que tampoco quiero parecer yo aquí la FED. 
Que tengo un remanente de capital que no se muy bien que hacer con el es cierto. Pero vamos que tampoco os imagineis de que para comprar una casa.
2 Me gusta
Pero si supone un % relevante respecto a lo que tienes invertido, lo cambia todo. No es lo mismo estar 100% invertido que tener un 50% de liquidez. Si TROW te pesa un 7% en la cartera pero tienes un 50% de liquidez la cosa cambia mucho porque ante bajada notable podrías meter un buen chute en cualquier otra y que las nuevas compras pasen a formar el 4-5% de la cartera.
2 Me gusta
Por el momento quiero limitarme a seguir el plan, porque veo que el manejo de la liquidez es incluso igual (no quiero decir más) de complicado que el manejo de las compras.
Ahora mismo con toda sinceridad te digo que no sabría gestionar una bajada “de verdad”
1 me gusta
La gestión de esas situaciones tampoco tiene grandes secretos: apretar el culo, sacar el paraguas y esperar a que pase la tormenta.
Vas bien, no te tortures, pero a la hora de tomar decisiones no te dejes la liquidez. No es lo mismo un 1%, un 10% o un 50%. Y ciertamente, todos nos acojonamos si llegan grandes bajadas.
2 Me gusta
Espero que, lo tengas donde lo tengas, no te acuerdes donde, porque eres un peligro con dinero en las manos ![]()

Asi es, a mi esto me sugiere que deberias calcular la ponderacion de tus valores no por capital invertido sino teniendo en cuenta tambien esa liquidez
4 Me gusta
Prefiero precisamente por capital invertido precisamente para eso, para no acordarme que tengo algo más de capital apartado para inversion ![]()
En mi excel si que lo tengo referenciado, pero la cartera DGI prefiero tenerla como un módulo aparte, e ir aportando religiosamente lo acordado en mi mente.
3 Me gusta
Estar tranquilo, fundamental.
y como decía el otro espera lo mejor , prepárate para lo peor
3 Me gusta
IPC. Es por ley UE el maquillaje, digooooo revisión cada 5 años.
Pasa igual con el PIB u otras estadísticas.
1 me gusta
Hoy os voy a traer un experimento. La idea es conseguir un total return del 50% anual. Así de chulo soy (sin dinero real soy muy “echao palante”). La estrategia es la siguiente:
Buscamos acciones que tengan:
VL Timeliness Rank 1 o 2
VL Technical Rank 1 o 2
VL Safety Rank 1 o 2
VL 18 Month Pricing Band al menos un 25% de subida potencial
VL Porjected Low Total Return al menos un 10%
De las pocas que queden solo admitiremos las que tengan wide moat, uncertainty high o mejor, quitaremos las que tengan poor stewardship, y además queremos que el P/FV sea menor que uno.
Las que salgan las compramos y mantenemos hasta que los ratings de timelines o safety pasen a 3 o más, que obtengamos un 50% de rentabilidad anual, siempre y cuando haya otra candidata mejor para comprar.
Empezamos con 15.000 euros. Las que han salido son las siguientes:
| SecId | Ticker | Name | Sector | Industry | Last | Div Yield | M* Moat | M* MoatQ | M* MoatQ Score | M* Stewardship | M* Uncertainty | M* UncertaintyQ | M* UncertaintyQ Score | M* distance to Default | Div frequency | FV | FVQ | Timeliness™ | Technical Rank | Safety™ | Financial Strength Rating | P/FV | 18 Month Pricing Band | Proj High TTL Return | Proj Low TTL Return |
|---|---|---|---|---|---|---|---|---|---|---|---|---|---|---|---|---|---|---|---|---|---|---|---|---|---|
| 0P000000B7 | XNAS:AMZN | Amazon.com Inc | Consumer Discretionary | Internet Retail | $3,152.8 | — | Wide | Wide | 0.999398 | Exemplary | High | High | 0.286511 | 0.687785 | — | $4,100.0 | $3,486.9 | 1 | 2 | 1 | A++ | 0.831 | 45% | 15% | 10% |
| 0P00012BBI | XNAS:GOOG | Alphabet Inc | Communication Services | Internet Content & Information | $2,860.3 | — | Wide | Wide | 0.999298 | Exemplary | High | High | 0.230286 | 0.80829 | — | $3,600.0 | $3,004.1 | 1 | 2 | 1 | A++ | 0.866 | 30% | 18% | 12% |
| 0P0000059E | XNAS:TROW | T. Rowe Price Group Inc | Financials | Asset Management | $148.7 | 2.91% | Wide | Wide | 0.997661 | Exemplary | Medium | High | 0.215885 | 0.806309 | Quarterly | $195.0 | $184.6 | 2 | 1 | 1 | A+ | 0.783 | 50% | 15% | 10% |
Imaginemos que usamos el broker de ING. Compramos 2 de Amazon, 2 de Google y 33 de TROW a precio de apertura de hoy. Ya iré actualizando cuando haya cambios.
Nota 1: El sistema no lo he probado, es posible que de rentabilidad negativa
Nota 2: El que es pobre es porque quiere existiendo este sistema
Nota 3: El que quiera vender el método, dar cursos, o escribir un libro que lo haga, no está registrado ni nada.
22 Me gusta
Gracias. Me encanta leer todos tus planteamientos
3 Me gusta
Hoy os voy a poner las recomendaciones de compra para el mes de marzo. Mis criterios son los siguientes:
- Value Line Safety 3 o mejor
- Value Line Financial Streng B++ o mejor
- Low Projected Total Return 10% o más
- 18 month band price 10% o más
- Wide moat
- Si es narrow moat debe tener Stewardship Exemplary
| SecId | Ticker | Name | Sector | Industry | Currency | Last | Div Yield | Div frequency | Moat | MoatQ | MoatQ Score | Stewardship | Uncertainty | UncertaintyQ | UncertaintyQ Score | Distance to Default | Safety™ | Timeliness™ | Financial Strength Rating | Technical Rank | Earnings Predictability | Price Growth Persistence | Price Stability | FV | FVQ | M* P / FV | FT Target Price | Upside Potential | Proj Low TTL Return | Proj High TTL Return | Proj % Annual Total Return | 18 Month Pricing Band |
|---|---|---|---|---|---|---|---|---|---|---|---|---|---|---|---|---|---|---|---|---|---|---|---|---|---|---|---|---|---|---|---|---|
| 0P000000YD | XNAS:CHRW | C.H. Robinson Worldwide Inc | Industrials | Integrated Freight & Logistics | USD | 96.79 | 2.15% | Quarterly | Wide | Wide | 1.00 | Exemplary | Medium | Medium | 0.11 | 0.67 | 2 | 5 | A | 2 | 70 | 50 | 95 | 96.00 | 96.57 | 1.01 | 106.00 | 10% | 13% | 21% | 17% | 25% |
| 0P000000F0 | XNAS:AMGN | Amgen Inc | Health Care | Drug Manufacturers - General | USD | 227.03 | 3.18% | Quarterly | Wide | Wide | 1.00 | Exemplary | Medium | High | 0.18 | 0.69 | 1 | 4 | A++ | 3 | 100 | 75 | 100 | 260.00 | 229.28 | 0.93 | 250.00 | 10% | 12% | 18% | 15% | 10% |
| 0P000001R9 | XNYS:DPZ | Domino’s Pizza Inc | Consumer Discretionary | Restaurants | USD | 429.98 | 0.87% | Quarterly | Wide | Wide | 1.00 | Exemplary | Medium | High | 0.18 | 0.60 | 2 | 3 | A | 3 | 100 | 95 | 75 | 416.00 | 410.00 | 1.04 | 498.00 | 16% | 10% | 18% | 14% | 50% |
| 0P0000W3KZ | XNAS:FB | Meta Platforms Inc | Communication Services | Internet Content & Information | USD | 210.48 | — | — | Wide | Wide | 1.00 | Exemplary | High | Very High | 0.47 | 0.69 | 2 | 1 | A++ | 2 | 65 | 95 | 65 | 400.00 | 339.82 | 0.57 | 350.00 | 66% | 18% | 27% | 23% | 100% |
| 0P000001DB | XNAS:CMCSA | Comcast Corp | Communication Services | Entertainment | USD | 47.07 | 2.12% | Quarterly | Wide | Wide | 1.00 | Standard | Medium | High | 0.17 | 0.63 | 1 | 1 | A+ | 4 | 90 | 85 | 100 | 60.00 | 56.07 | 0.81 | 62.00 | 32% | 13% | 19% | 16% | 25% |
| 0P00012BBI | XNAS:GOOG | Alphabet Inc | Communication Services | Internet Content & Information | USD | 2690.39 | — | — | Wide | Wide | 1.00 | Exemplary | High | High | 0.30 | 0.80 | 1 | 1 | A++ | 2 | 75 | 100 | 95 | 3,600.00 | 3,080.74 | 0.81 | 3,560.00 | 32% | 12% | 18% | 15% | 35% |
| 0P000001BI | XNAS:CSGP | CoStar Group Inc | Industrials | Real Estate Services | USD | 61.7 | — | — | Wide | Wide | 1.00 | Exemplary | Very High | High | 0.17 | 0.76 | 2 | 3 | A+ | 2 | 65 | 95 | 75 | 73.00 | 74.60 | 0.84 | 84.00 | 36% | 11% | 20% | 16% | 70% |
| 0P0000020J | XNAS:ERIE | Erie Indemnity Co | Financials | Insurance Brokers | USD | 177.51 | 2.37% | Quarterly | — | Wide | 0.99 | — | — | High | 0.26 | 0.77 | 2 | 3 | A | 4 | 95 | 70 | 90 | — | 164.00 | 1.08 | 115.00 | -35% | 10% | 17% | 14% | 30% |
| 0P000000B7 | XNAS:AMZN | Amazon.com Inc | Consumer Discretionary | Internet Retail | USD | 3075.77 | — | — | Wide | Wide | 1.00 | Exemplary | High | High | 0.28 | 0.68 | 1 | 1 | A++ | 3 | 30 | 90 | 80 | 4,100.00 | 3,449.15 | 0.81 | 4,025.00 | 31% | 10% | 15% | 13% | 50% |
| 0P000000OE | XNAS:BIDU | Baidu Inc | Communication Services | Internet Content & Information | USD | 153.11 | — | — | Wide | Wide | 1.00 | Standard | High | High | 0.19 | 0.76 | 3 | – | A | – | 45 | 30 | 35 | 183.00 | 199.97 | 0.80 | 218.66 | 43% | 18% | 31% | 25% | 15% |
| 0P000003IL | XNYS:SPGI | S&P Global Inc | Financials | Financial Data & Stock Exchanges | USD | 380.89 | 0.81% | Quarterly | Wide | Wide | 1.00 | Exemplary | Medium | Medium | 0.14 | 0.79 | 2 | 1 | A | 2 | 100 | 95 | 95 | 425.00 | 392.13 | 0.93 | 491.50 | 29% | 10% | 16% | 13% | 40% |
| 0P000004EA | XNYS:PII | Polaris Inc | Consumer Discretionary | Recreational Vehicles | USD | 119.73 | 2.10% | Quarterly | Wide | Wide | 1.00 | Exemplary | High | Very High | 0.37 | 0.60 | 3 | 5 | A | 5 | 55 | 25 | 40 | 184.00 | 145.19 | 0.73 | 145.00 | 21% | 12% | 23% | 18% | 15% |
| 0P0000059E | XNAS:TROW | T. Rowe Price Group Inc | Financials | Asset Management | USD | 145.26 | 2.97% | Quarterly | Wide | Wide | 1.00 | Exemplary | Medium | High | 0.16 | 0.77 | 1 | 2 | A+ | 1 | 90 | 50 | 85 | 195.00 | 192.93 | 0.75 | 170.00 | 17% | 10% | 15% | 13% | 55% |
| 0P0000042B | XNAS:OMCL | Omnicell Inc | Health Care | Health Information Services | USD | 126.37 | — | — | — | Wide | 0.99 | — | — | High | 0.32 | 0.69 | 3 | 2 | B++ | 2 | 30 | 100 | 65 | — | 136.94 | 0.92 | 186.50 | 48% | 11% | 23% | 17% | 65% |
| 0P000003JU | XNYS:MDT | Medtronic PLC | Health Care | Medical Devices | USD | 105.84 | 2.33% | Quarterly | Wide | Wide | 1.00 | Standard | Medium | High | 0.18 | 0.72 | 1 | 3 | A++ | 3 | 75 | 80 | 95 | 129.00 | 119.57 | 0.85 | 124.00 | 17% | 10% | 15% | 13% | 35% |
| 0P00009FL7 | XNAS:MELI | MercadoLibre Inc | Consumer Discretionary | Internet Retail | USD | 1111.39 | — | Quarterly | Wide | Wide | 1.00 | Exemplary | High | High | 0.24 | 0.52 | 3 | 2 | B++ | 4 | 15 | 95 | 25 | 1,580.00 | 1,459.91 | 0.73 | 1,650.00 | 48% | 16% | 28% | 22% | 25% |
| 0P000005M8 | XNYS:UL | Unilever PLC | Consumer Staples | Household & Personal Products | USD | 50.55 | 3.96% | Quarterly | Wide | Wide | 1.00 | Standard | Low | High | 0.15 | 0.69 | 1 | 5 | A+ | 5 | 80 | 45 | 100 | 59.00 | 51.85 | 0.91 | 62.00 | 23% | 12% | 17% | 15% | 20% |
| 0P000003ZC | XNYS:NVS | Novartis AG | Health Care | Drug Manufacturers - General | USD | 87.63 | 3.65% | Annually | Wide | Wide | 1.00 | Standard | Low | Medium | 0.11 | 0.78 | 1 | 4 | A++ | 3 | 55 | 30 | 100 | 91.00 | 87.34 | 0.98 | 104.00 | 19% | 10% | 15% | 13% | 15% |
| 0P00000546 | XNAS:SBUX | Starbucks Corp | Consumer Discretionary | Restaurants | USD | 92.58 | 2.03% | Quarterly | Wide | Wide | 1.00 | Exemplary | Medium | High | 0.20 | 0.68 | 1 | 2 | A++ | 3 | 45 | 70 | 85 | 106.00 | 97.10 | 0.91 | 115.00 | 24% | 11% | 17% | 14% | 40% |
| 0P000005V9 | XNYS:WAT | Waters Corp | Health Care | Diagnostics & Research | USD | 323.65 | — | Annually | Wide | Wide | 1.00 | Exemplary | Medium | Medium | 0.15 | 0.72 | 2 | 4 | A | 3 | 95 | 90 | 85 | 250.00 | 272.55 | 1.24 | 350.00 | 8% | 14% | 25% | 20% | 20% |
| 0P000004FA | XNYS:LIN | Linde PLC | Materials | Specialty Chemicals | USD | 297.49 | 1.43% | Quarterly | Narrow | Wide | 0.99 | Standard | Medium | Medium | 0.11 | 0.73 | 2 | 3 | A | 1 | – | – | 95 | 325.00 | 297.87 | 0.96 | 375.00 | 26% | 10% | 18% | 14% | 15% |
| 0P000003KE | XNYS:MRK | Merck & Co Inc | Health Care | Drug Manufacturers - General | USD | 76.32 | 3.46% | Quarterly | Wide | Wide | 1.00 | Standard | Medium | High | 0.19 | 0.70 | 1 | 2 | A++ | 1 | 100 | 50 | 95 | 94.00 | 82.94 | 0.86 | 93.00 | 22% | 10% | 15% | 13% | 25% |
| 0P00018WBW | XNYS:YUMC | Yum China Holdings Inc | Consumer Discretionary | Restaurants | USD | 52.05 | 0.92% | Quarterly | Wide | Wide | 1.00 | Standard | Medium | High | 0.26 | 0.80 | 3 | 4 | B++ | 5 | 65 | 90 | 70 | 86.00 | 72.50 | 0.66 | 60.76 | 17% | 16% | 28% | 22% | 20% |
| 0P00000075 | XNYS:AMG | Affiliated Managers Group Inc | Financials | Asset Management | USD | 141.76 | 0.03% | Quarterly | Narrow | Narrow | 0.96 | Exemplary | High | High | 0.21 | 0.55 | 3 | 3 | B++ | 2 | 5 | 20 | 45 | 185.00 | 170.60 | 0.80 | 184.00 | 30% | 12% | 24% | 18% | 10% |
| 0P0000943F | XNYS:DFS | Discover Financial Services | Financials | Credit Services | USD | 124.01 | 1.56% | Quarterly | Narrow | Narrow | 0.84 | Exemplary | High | High | 0.35 | 0.88 | 3 | 4 | A | 3 | 40 | 75 | 35 | 135.00 | 141.73 | 0.90 | 144.00 | 16% | 13% | 24% | 19% | 25% |
| 0P000000UD | XNYS:SAM | Boston Beer Co Inc | Consumer Staples | Beverages - Brewers | USD | 380.53 | — | — | Narrow | Narrow | 0.98 | Exemplary | Medium | Very High | 0.52 | 0.58 | 3 | 3 | A+ | 3 | 60 | 55 | 45 | 750.00 | 771.73 | 0.50 | 475.00 | 25% | 10% | 22% | 16% | 50% |
| 0P000003PC | XNYS:MS | Morgan Stanley | Financials | Capital Markets | USD | 94.55 | 2.59% | Quarterly | Narrow | Narrow | 0.91 | Exemplary | High | High | 0.34 | 0.91 | 2 | 2 | B++ | 2 | 75 | 85 | 70 | 89.00 | 108.88 | 0.96 | 115.00 | 22% | 10% | 19% | 15% | 15% |
| 0P0001KOSE | XNYS:PLTR | Palantir Technologies Inc | Information Technology | Software - Infrastructure | USD | 11.47 | — | — | Narrow | Narrow | 0.96 | Exemplary | High | Very High | 0.61 | 0.63 | 3 | – | B++ | – | – | – | – | 31.00 | 23.17 | 0.42 | 15.00 | 31% | 23% | 36% | 30% | 205% |
Todos los meses pondré el resultado de lo que dé. Respecto a la lista ECSS del otro hilo, la doy por muerta. lleva mucha faena actualizarla y no le veo mucha utilidad, estando la CQSS, el índice Cazadividendos y las recomendaciones que se hacen en este foro. Con estas recomendaciones mensuales espero descubriros algunas oportunidades de inversión.
20 Me gusta
Acaba el mes de febrero y le echamos un vistazo a la cuenta de Indexa de mi hijo. El objetivo para 2039 es de 211.127,62 EUR . Actualmente llevamos acumulado 6.113,08 EUR y la rentabilidad actual es del 11,2%. Seguimos de bajada y la rentabilidad es todavía algo superior a la esperada. En fin, aún nos quedan 204 meses por delante y unos 205.000 euros para conseguir el objetivo. La aportación mensual debería ser de 305,52 EUR .
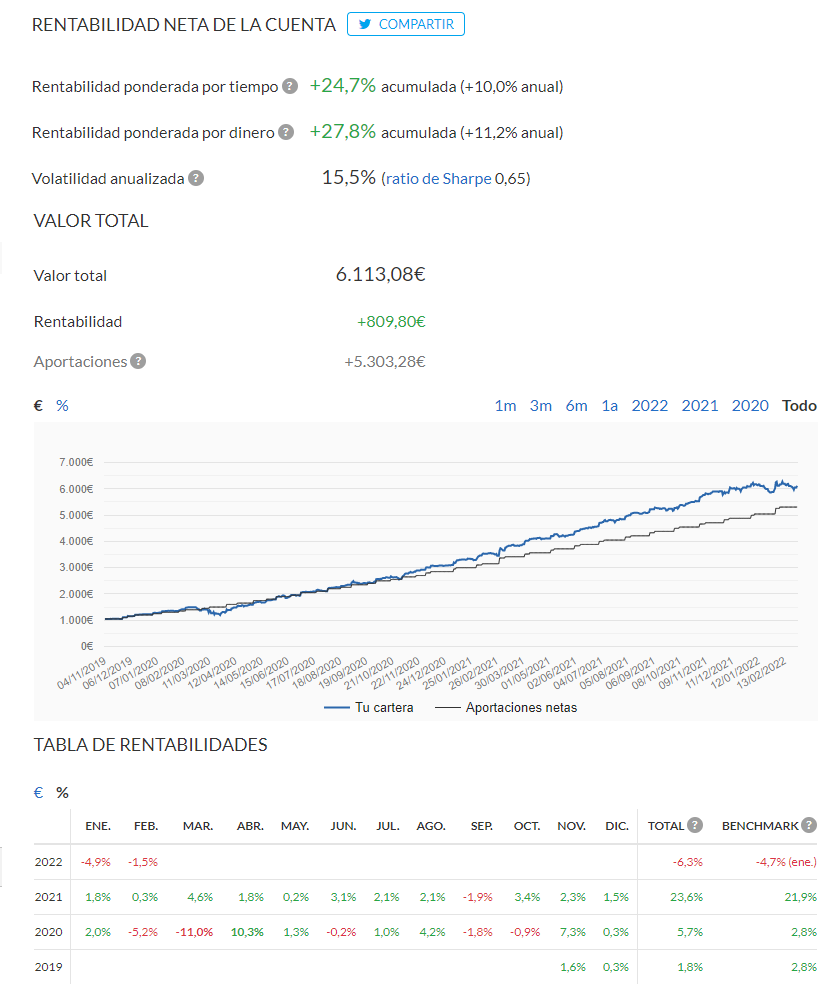
De momento quieto. Tendría ahora en mente Boston Beer, T. Row Price, Amazon, Google, Comcast y Merck. Con mucha liquidez ahora, que suba el euribor no supone ningún problema ni me planteo amortizar hipoteca. Ahora, si los tipos se ponen realmente altos empezaré a amortizar hasta que la cuota no se convierta en un problema. Ahora mismo tengo un 40% en liquidez. Sin miedo a la inflación. Es preferible no cometer errores. También pensando en pedir un préstamo para afrontar una inversión inmobiliaria fuera de España.
Nosotros a lo nuestro.
13 Me gusta
Termina Marzo y comienza la primavera y como de costumbre le echamos un vistazo a la cuenta de Indexa de mi hijo. El objetivo para 2039 es de 212.498,31 EUR (como sube la inflación!). Actualmente llevamos acumulado 6.711,21 EUR y la rentabilidad actual es del 13,6%. ¿Caerán algún día las bolsas de verdad de la buena?. En fin, aún nos quedan 203 meses por delante y unos 205.800 euros para conseguir el objetivo (vamos para atrás!! nos falta más que al principio!!). La aportación mensual debería ser de 213,53 EUR .
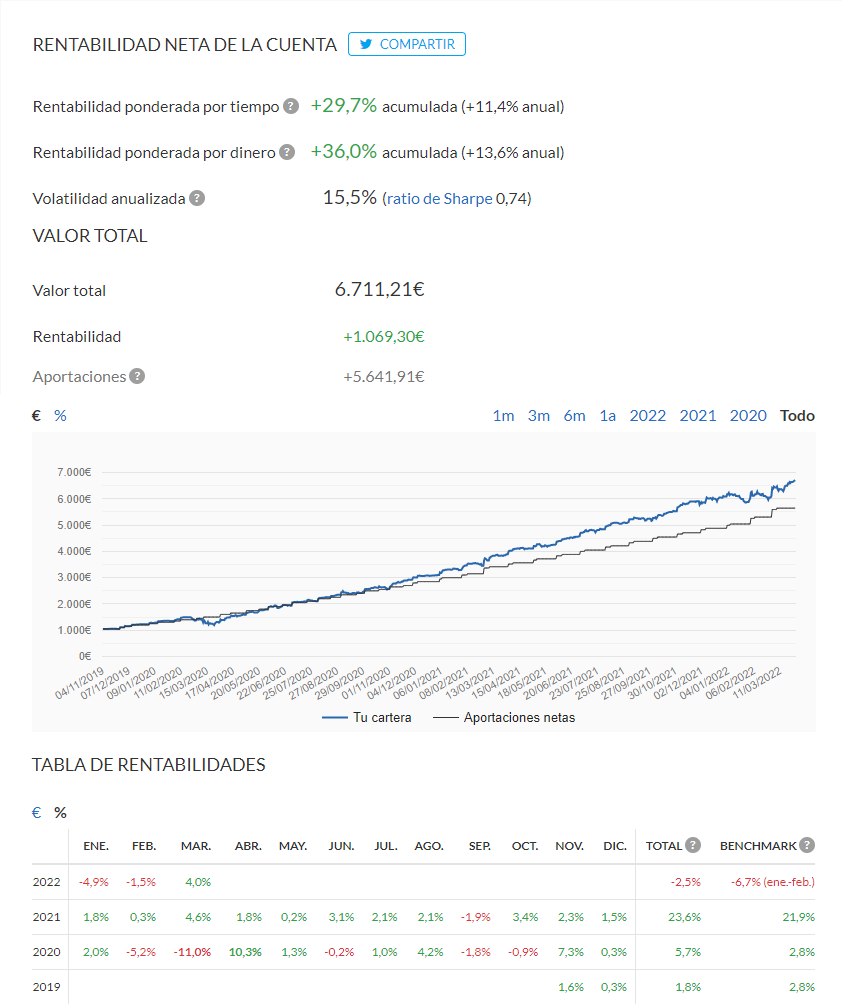
A ver como se comporta el Euribor, la inflación y todo lo demás también que diría Calamaro. De momento quieto. Si veo alguna buena oportunidad quizá compre algo.
8 Me gusta
La lista de la compra y una canción como un cupón de los ciegos para el mes de Abril:
| SecId | Ticker | Name | Sector | Industry | Currency | Last | Div Yield | Div frequency | M* Moat | M* Moat Trend | M* MoatQ | M* MoatQ Score | M* Stewardship | M* Uncertainty | M* UncertaintyQ | M* UncertaintyQ Score | M* distance to Default | Safety™ | Timeliness™ | Financial Strength Rating | Technical Rank | Earnings Predictability | Price Growth Persistence | Price Stability | FV | FVQ | M* P / FV | FT Target Price | Upside Potential | Proj Low TTL Return | Proj High TTL Return | Proj % Annual Total Return | 18 Month Pricing Band |
|---|---|---|---|---|---|---|---|---|---|---|---|---|---|---|---|---|---|---|---|---|---|---|---|---|---|---|---|---|---|---|---|---|---|
| 0P00009QS2 | XETR:SIE | Siemens AG | Industrials | Specialty Industrial Machinery | EUR | 126.70 | 3.16% | Annually | Narrow | Stable | Narrow | 0.986 | Exemplary | Medium | Medium | 0.113 | 0.568 | 2 | 3 | A | 3 | 75 | 25 | 80 | 145.00 | 140.96 | 0.886 | 178.00 | 40% | 16.0% | 25% | 21% | 20% |
| 0P000000FH | XNAS:ADI | Analog Devices Inc | Information Technology | Semiconductors | USD | 165.36 | 1.71% | Quarterly | Wide | Stable | Wide | 0.998 | Exemplary | Medium | Medium | 0.139 | 0.681 | 1 | 2 | A+ | 3 | 75 | 85 | 90 | 172.00 | 173.70 | 0.957 | 209.00 | 26% | 10.0% | 15% | 13% | 25% |
| 0P000000B7 | XNAS:AMZN | Amazon.com Inc | Consumer Discretionary | Internet Retail | USD | 3,271.20 | — | — | Wide | Stable | Wide | 1.000 | Exemplary | High | High | 0.235 | 0.671 | 1 | 1 | A++ | 5 | 30 | 90 | 80 | 4,100.00 | 3,405.76 | 0.872 | 4,000.00 | 22% | 10.0% | 15% | 13% | 20% |
| 0P000000YD | XNAS:CHRW | C.H. Robinson Worldwide Inc | Industrials | Integrated Freight & Logistics | USD | 103.13 | 2.06% | Quarterly | Wide | Negative | Wide | 0.997 | Exemplary | Medium | Medium | 0.137 | 0.649 | 2 | 5 | A | 3 | 70 | 50 | 95 | 96.00 | 100.36 | 1.050 | 106.00 | 3% | 13.0% | 21% | 17% | 10% |
| 0P000001DB | XNAS:CMCSA | Comcast Corp | Communication Services | Entertainment | USD | 47.70 | 2.10% | Quarterly | Wide | Stable | Wide | 0.997 | Standard | Medium | High | 0.159 | 0.636 | 1 | 2 | A+ | 4 | 90 | 85 | 100 | 60.00 | 55.63 | 0.825 | 60.00 | 26% | 18.0% | 22% | 20% | 25% |
| 0P000001BI | XNAS:CSGP | CoStar Group Inc | Industrials | Real Estate Services | USD | 66.00 | — | — | Wide | Stable | Wide | 0.996 | Exemplary | Very High | High | 0.175 | 0.743 | 2 | 3 | A+ | 3 | 65 | 95 | 75 | 73.00 | 77.54 | 0.877 | 75.50 | 14% | 11.0% | 20% | 16% | 25% |
| 0P0000020J | XNAS:ERIE | Erie Indemnity Co | Financials | Insurance Brokers | USD | 181.36 | 2.32% | Quarterly | — | — | Wide | 0.995 | — | — | High | 0.233 | 0.768 | 2 | 4 | A | 4 | 95 | 70 | 90 | — | 168.23 | 1.078 | 115.00 | -37% | 10.0% | 17% | 14% | 30% |
| 0P0000W3KZ | XNAS:FB | Meta Platforms Inc | Communication Services | Internet Content & Information | USD | 224.85 | — | — | Wide | Stable | Wide | 0.998 | Exemplary | High | Very High | 0.412 | 0.671 | 2 | 1 | A++ | 4 | 65 | 95 | 65 | 400.00 | 362.42 | 0.590 | 338.00 | 50% | 18.0% | 27% | 23% | 15% |
| 0P000002FD | XNAS:GILD | Gilead Sciences Inc | Health Care | Drug Manufacturers - General | USD | 59.67 | 4.79% | Quarterly | Wide | Stable | Wide | 0.999 | Standard | Medium | High | 0.204 | 0.690 | 1 | 2 | A | 4 | 25 | 30 | 100 | 81.00 | 67.21 | 0.805 | 70.00 | 17% | 11.0% | 17% | 14% | 25% |
| 0P00012BBI | XNAS:GOOG | Alphabet Inc | Communication Services | Internet Content & Information | USD | 2,814.00 | — | — | Wide | Stable | Wide | 0.999 | Exemplary | High | High | 0.234 | 0.791 | 1 | 1 | A++ | 3 | 75 | 100 | 95 | 3,600.00 | 3,065.03 | 0.844 | 3,380.00 | 20% | 12.0% | 18% | 15% | 30% |
| 0P0000042B | XNAS:OMCL | Omnicell Inc | Health Care | Health Information Services | USD | 129.11 | — | — | — | — | Wide | 0.991 | — | — | High | 0.267 | 0.705 | 3 | 3 | B++ | 3 | 30 | 100 | 65 | — | 125.02 | 1.033 | 183.00 | 42% | 11.0% | 23% | 17% | 30% |
| 0P000004J4 | XNAS:QCOM | Qualcomm Inc | Information Technology | Semiconductors | USD | 146.99 | 1.85% | Quarterly | Narrow | Negative | Wide | 0.995 | Standard | High | Medium | 0.137 | 0.622 | 3 | 1 | A+ | 2 | 60 | 40 | 50 | 163.00 | 155.84 | 0.922 | 210.00 | 43% | 14.0% | 25% | 20% | 55% |
| 0P00000546 | XNAS:SBUX | Starbucks Corp | Consumer Discretionary | Restaurants | USD | 91.49 | 2.05% | Quarterly | Wide | Stable | Wide | 1.000 | Exemplary | Medium | High | 0.161 | 0.649 | 1 | 2 | A++ | 3 | 45 | 70 | 85 | 106.00 | 101.64 | 0.881 | 115.00 | 26% | 11.0% | 17% | 14% | 15% |
| 0P000004ZF | XNAS:SWKS | Skyworks Solutions Inc | Information Technology | Semiconductors | USD | 132.03 | 1.65% | Quarterly | Narrow | Stable | Narrow | 0.981 | Exemplary | High | High | 0.217 | 0.649 | 3 | 3 | A | 4 | 70 | 65 | 55 | 210.00 | 185.17 | 0.668 | 175.00 | 33% | 18.0% | 30% | 24% | 45% |
| 0P0000059E | XNAS:TROW | T. Rowe Price Group Inc | Financials | Asset Management | USD | 152.86 | 2.90% | Quarterly | Wide | Stable | Wide | 0.997 | Exemplary | Medium | High | 0.179 | 0.760 | 1 | 3 | A+ | 4 | 90 | 50 | 85 | 195.00 | 199.77 | 0.774 | 159.00 | 4% | 10.0% | 15% | 13% | 20% |
| 0P00000016 | XNYS:ABB | ABB Ltd | Industrials | Electrical Equipment & Parts | USD | 32.87 | 2.70% | Annually | Wide | Stable | Wide | 0.998 | Standard | Medium | Medium | 0.121 | 0.729 | 2 | 2 | B++ | 2 | 65 | 30 | 90 | 38.00 | 34.39 | 0.908 | 40.00 | 22% | 10.0% | 18% | 14% | 15% |
| 0P00000075 | XNYS:AMG | Affiliated Managers Group Inc | Financials | Asset Management | USD | 144.47 | 0.03% | Quarterly | Narrow | Negative | Narrow | 0.946 | Exemplary | High | High | 0.177 | 0.530 | 3 | 3 | B++ | 2 | 5 | 20 | 45 | 185.00 | 186.67 | 0.777 | 186.50 | 29% | 12.0% | 24% | 18% | 15% |
| 0P0000943F | XNYS:DFS | Discover Financial Services | Financials | Credit Services | USD | 110.12 | 1.76% | Quarterly | Narrow | Stable | None | 0.634 | Exemplary | High | Very High | 0.354 | 0.870 | 3 | 4 | A | 2 | 40 | 75 | 35 | 138.00 | 121.90 | 0.847 | 144.00 | 31% | 13.0% | 24% | 19% | 40% |
| 0P000001R9 | XNYS:DPZ | Domino’s Pizza Inc | Consumer Discretionary | Restaurants | USD | 397.18 | 0.99% | Quarterly | Wide | Stable | Wide | 0.997 | Exemplary | Medium | High | 0.166 | 0.578 | 2 | 3 | A | 2 | 100 | 95 | 75 | 416.00 | 388.25 | 0.988 | 475.00 | 20% | 10.0% | 18% | 14% | 35% |
| 0P00000357 | XNYS:KMB | Kimberly-Clark Corp | Consumer Staples | Household & Personal Products | USD | 125.03 | 3.66% | Quarterly | Narrow | Stable | Wide | 0.994 | Exemplary | Medium | Medium | 0.106 | 0.701 | 1 | 4 | A | 3 | 60 | 45 | 100 | 125.00 | 120.94 | 1.017 | 128.00 | 2% | 10.0% | 16% | 13% | 15% |
| 0P000003JU | XNYS:MDT | Medtronic PLC | Health Care | Medical Devices | USD | 112.52 | 2.24% | Quarterly | Wide | Stable | Wide | 0.999 | Standard | Medium | High | 0.182 | 0.712 | 1 | 3 | A++ | 5 | 75 | 80 | 95 | 129.00 | 117.91 | 0.911 | 124.00 | 10% | 10.0% | 15% | 13% | 25% |
| 0P0000000I | XNYS:MMM | 3M Co | Industrials | Conglomerates | USD | 149.69 | 3.96% | Quarterly | Wide | Stable | Wide | 1.000 | Standard | Medium | High | 0.202 | 0.701 | 1 | 4 | A++ | 4 | 95 | 50 | 95 | 192.00 | 171.01 | 0.825 | 173.00 | 16% | 14.0% | 19% | 17% | 25% |
| 0P000003KE | XNYS:MRK | Merck & Co Inc | Health Care | Drug Manufacturers - General | USD | 83.52 | 3.21% | Quarterly | Wide | Stable | Wide | 0.999 | Standard | Medium | High | 0.151 | 0.687 | 1 | 2 | A++ | 5 | 100 | 50 | 95 | 94.00 | 85.95 | 0.928 | 93.00 | 11% | 13.0% | 18% | 16% | 10% |
| 0P000003ZC | XNYS:NVS | Novartis AG | Health Care | Drug Manufacturers - General | USD | 87.69 | 3.79% | Annually | Wide | Stable | Wide | 0.998 | Standard | Low | Medium | 0.117 | 0.774 | 1 | 4 | A++ | 4 | 55 | 30 | 100 | 91.00 | 87.52 | 0.982 | 104.00 | 19% | 11.0% | 16% | 14% | 15% |
| 0P000004EA | XNYS:PII | Polaris Inc | Consumer Discretionary | Recreational Vehicles | USD | 106.44 | 2.38% | Quarterly | Wide | Stable | Wide | 0.996 | Exemplary | High | Very High | 0.505 | 0.576 | 3 | 5 | A | 3 | 55 | 25 | 40 | 184.00 | 135.11 | 0.667 | 145.00 | 36% | 12.0% | 23% | 18% | 30% |
| 0P000000UD | XNYS:SAM | Boston Beer Co Inc | Consumer Staples | Beverages - Brewers | USD | 391.15 | — | — | Narrow | Stable | Narrow | 0.976 | Exemplary | Medium | Very High | 0.520 | 0.586 | 3 | 4 | A+ | 4 | 60 | 55 | 45 | 750.00 | 702.35 | 0.539 | 475.00 | 21% | 10.0% | 22% | 16% | 25% |
| 0P000003IL | XNYS:SPGI | S&P Global Inc | Financials | Financial Data & Stock Exchanges | USD | 407.88 | 0.76% | Quarterly | Wide | Stable | Wide | 1.000 | Exemplary | Medium | Medium | 0.135 | 0.776 | 2 | 1 | A | 3 | 100 | 95 | 95 | 430.00 | 392.78 | 0.991 | 485.00 | 19% | 10.0% | 16% | 13% | 30% |
| 0P000005AR | XNYS:TSM | Taiwan Semiconductor Manufacturing Co Ltd | Information Technology | Semiconductors | USD | 102.79 | 1.88% | Quarterly | Wide | Stable | Wide | 0.999 | Exemplary | Medium | Very High | 0.447 | 0.799 | 1 | 3 | A++ | 1 | 80 | 95 | 80 | 179.00 | 129.79 | 0.666 | 157.90 | 54% | 10.0% | 18% | 14% | 60% |
| 0P000005M8 | XNYS:UL | Unilever PLC | Consumer Staples | Household & Personal Products | USD | 46.60 | 4.30% | Quarterly | Wide | Stable | Wide | 1.000 | Standard | Low | High | 0.175 | 0.665 | 1 | 5 | A+ | 3 | 80 | 45 | 100 | 56.00 | 50.50 | 0.875 | 62.00 | 33% | 12.0% | 17% | 15% | 30% |
| 0P000005V9 | XNYS:WAT | Waters Corp | Health Care | Diagnostics & Research | USD | 308.58 | — | Annually | Wide | Stable | Wide | 0.999 | Exemplary | Medium | Medium | 0.118 | 0.715 | 2 | 4 | A | 3 | 95 | 90 | 85 | 250.00 | 260.95 | 1.208 | 350.00 | 13% | 14.0% | 25% | 20% | 20% |
8 Me gusta