En mi época anterior en Renta4 así era. Los han subido, no sé cuándo, pero así es.
2 Me gusta

2 Me gusta
3 Me gusta
Yo creo que en esa excel falta la opcion de Bankinter. Comision de custodia 0,16% + IVA que es menor que Selfbank y Renta4 y es un banco mas conocido y ¿solvente? que MyInvestor y GPM.
1 me gusta
Yo añadiría Degiro con sus ETFs de operativa gratuita, tienes varios MSCI Worlds y ACWI y el Vanguard FTSE All-world con una compra o venta sin comisiones al mes.
1 me gusta
Ya hemos visto este tema varias veces en el foro pero ![]()
![]()
- Mientras el yield es bajo, es muy fácil y barato incrementarlo en un % alto. Total, unos pocos céntimos se sacan de cualquier parte (del FCF si lo hay y si no, de aumentar la deúda).
- Cuando aplicamos la matemática del interés compuesto a plazos largos, se nos hace la boca agua
 y damos por bien empleado el tiempo perdido con dividendos miserables.
 - Lo malo es que la mayoría de las veces, al alcanzar el yield unos valores razonables el incremento anual se ha ralentizado

9 Me gusta
-
Caso A:
Cotización 100 eur
Dividendo por acción 5 eur
Yield 5%
La empresa A decide aumentar el dividendo en 1 eur. Es decir, aumenta el dividendo en un 20%. -
Caso B:
Cotización 300 eur
Dividendo por acción 5 eur
Yield 1,66%
La empresa B decide aumentar el dividendo en 1 eur. Es decir, aumenta su dividendo en un 20%.
Tanto a la empresa A (yield alto) como a la empresa B (yield bajo) le ha costado lo mismo incrementar su dividendo en un porcentaje alto.
El yield de una empresa no lo decide la empresa, lo decide el mercado. La empresa puede decidir qué dividendo paga pero no a qué yield cotiza:
RPD = DPA/Cotización
La empresa decidirá el numerador, pero el denominador lo decide el mercado.
Es justo al revés: como el incremento de los beneficios/dividendos se ha ralentizado, el mercado exige un yield superior para compensar el riesgo de comprar esa acción. ¿Cómo hace eso el mercado? Reduciendo el denominador de la ecuación anterior. Es decir, bajando la cotización.
Ya sabéis: no hay duros a cuatro pesetas.
8 Me gusta
Bankinter sí es más conocido que Andbank (Myinvestor) al ser un banco tradicional (Andbank es más un banco de inversiones), pero parece que no es más solvente. En 2020 el ratio de solvencia de Andbank está muy por encima del de Bankinter (17% frente al 12% en números redondos) y de la mayoría de bancos tradicionales españoles.
3 Me gusta
La banca andorrana en general se ha visto salpicada por casos de corrupcion, caso pujol, itv, … Su reputacion puede ser que este en entredicho. Ademas los bancos de inversion son menos previsibles por su variabilidad. Yo estaria mas tranquilo con BK a largo plazo.
1 me gusta
Lo de la corrupción es generalizar, creo yo. De igual forma podría decirse que la banca tradicional española se ha visto salpicada por sus casos de insolvencia y rescate. En mi opinión, creo que para invertir sería mejor un banco de inversión (Andbank, banca march, r4…) que un banco tradicional español.
De todas formas, yo como tantos otros por aquí soy muy ratita en el tema de las comisiones, por eso en principio tengo fondos en myinvestor. Si en el futuro suben las comisiones, posiblemente cambie a Openbank.
4 Me gusta
Por supuesto. En realidad no podemos tener confianza plena con seguridad en ninguna entidad. Pero el principio que intento aplicar en las inversiones es el de reducir el numero de intermediarios al maximo. Por ello la inversion directa en compañias siempre tendra una mayor ponderacion en mi cartera.
1 me gusta
El primero de la lista el Ishares developed index fund es el utilizado para que mi hijo aporte al mismo 200€ todos los meses con Myinvestor con un ter del 0,12%.
Ponme 2 amundi para llevar
Bueno, es el TER correspondiente más ese 0.19% de comisión de custodia. Aclaro.
Una de las cosas que me mata es tener el seguimiento historico de los datos de DPS y sobre todo de EPS de las acciones en cartera.
Esto es una de las pestañas de mi Google Spreadsheet donde tengo la informacion de las inversiones. A veces dudo si borrar esta pestaña y liberar mi mente 
| Average Target Price | DPS 2000 | DPS 2001 | DPS 2002 | DPS 2003 | DPS 2004 | DPS 2005 | DPS 2006 | DPS 2007 | DPS 2008 | DPS 2009 | DPS 2010 | DPS 2011 | DPS 2012 | DPS 2013 | DPS 2014 | DPS 2015 | DPS 2016 | DPS 2017 | DPS 2018 | DPS 2019 | DPS 2020 | DPS 2021 | DPS 2022 | DPS 2023 | EPS 2002 | EPS 2003 | EPS 2004 | EPS 2005 | EPS 2006 | EPS 2007 | EPS 2008 | EPS 2009 | EPS 2010 | EPS 2011 | EPS 2012 | EPS 2013 | EPS 2014 | EPS 2015 | EPS 2016 | EPS 2017 | EPS 2018 | EPS 2019 | EPS 2020 | EPS 2021 | EPS 2022 | EPS 2023 | ||
|---|---|---|---|---|---|---|---|---|---|---|---|---|---|---|---|---|---|---|---|---|---|---|---|---|---|---|---|---|---|---|---|---|---|---|---|---|---|---|---|---|---|---|---|---|---|---|---|---|
| ABBOTT LABORATORIES | 130.28 | 2021 | x | x | x | x | x | x | x | x | x | x | x | x | x | 0.64 | 0.9 | 0.98 | 1.045 | 1.075 | 1.16 | 1.32 | 1.53 | 1.71 | 1.82 | 1.98 | x | x | x | x | x | x | x | x | x | x | x | 1.64 | 1.98 | 2.15 | 2.2 | 2.5 | 2.88 | 3.24 | 3.65 | 3.3 | 3.6 | 4.16 |
| ABBVIE INC | 125.48 | 2021 | x | x | x | x | x | x | x | x | x | x | x | x | x | 2 | 1.75 | 2.1 | 2.35 | 2.63 | 3.95 | 4.39 | 4.84 | 5.12 | 5.53 | 5.66 | x | x | x | x | x | x | x | x | x | x | x | 3.14 | 3.32 | 4.29 | 4.82 | 5.6 | 7.91 | 8.94 | 10.56 | 7.32 | 9.01 | 7.73 |
| ACTIVISION BLIZZARD INC | 113.05 | 2021 | x | x | x | x | x | x | x | x | x | x | 0.15 | 0.165 | 0.18 | 0.19 | 0.2 | 0.23 | 0.26 | 0.3 | 0.34 | 0.37 | 0.41 | 0.47 | 0.53 | 0.57 | x | x | x | x | x | x | -0.08 | 0.69 | 0.79 | 0.93 | 1.18 | 0.94 | 1.24 | 1.3 | 2.18 | 2.21 | 2.72 | 2.31 | 3.21 | 3.24 | 3.69 | 4 |
| ADMIRAL GROUP PLC | 2,859.79 | 2021 | x | x | x | x | 9.3 | 24.6 | 36.1 | 43.8 | 52.5 | 57.5 | 68.1 | 75.6 | 90.6 | 99.5 | 98.4 | 114.4 | 114.4 | 114 | 126 | 140 | 156.5 | 297 | 177 | 148 | x | x | 35 | 32.7 | 39.8 | 48.6 | 54.9 | 59 | 72.2 | 81.7 | 94.9 | 104.4 | 102.8 | 107.1 | 78.5 | 117 | 136.8 | 148 | 179.2 | 351 | 149 | 151 |
| AIR PRODUCTS & CHEMICALS INC | 314.43 | 2021 | 0.74 | 0.78 | 0.82 | 0.88 | 1.04 | 1.25 | 1.34 | 1.48 | 1.7 | 1.79 | 1.92 | 2.23 | 2.5 | 2.77 | 3.02 | 3.2 | 3.39 | 3.71 | 4.25 | 4.58 | 5.18 | 5.84 | 6.33 | 6.93 | 2.36 | 1.78 | 2.64 | 3.08 | 3.18 | 4.64 | 4.15 | 2.96 | 4.74 | 5.63 | 5.44 | 4.68 | 4.61 | 5.88 | 2.89 | 13.65 | 6.78 | 7.94 | 8.49 | 9.15 | 10.5 | 11.9 |
| ALTRIA GROUP INC | 53.31 | 2021 | x | x | x | x | x | x | x | x | 0.93 | 1.32 | 1.46 | 1.58 | 1.7 | 1.84 | 2 | 2.17 | 2.35 | 2.54 | 3 | 3.28 | 3.4 | 3.52 | 3.73 | 3.95 | x | x | x | x | x | x | 1.65 | 1.75 | 1.9 | 2.05 | 2.21 | 2.38 | 2.57 | 2.8 | 3.03 | 3.39 | 3.99 | 4.21 | 4.36 | 4.24 | 4.66 | 4.85 |
| A.O. SMITH CORP | 74.00 | 2021 | 0.08333333333 | 0.08666666667 | 0.09 | 0.09666666667 | 0.1033333333 | 0.1066666667 | 0.11 | 0.1166666667 | 0.1233333333 | 0.1283333333 | 0.135 | 0.15 | 0.18 | 0.23 | 0.3 | 0.38 | 0.48 | 0.56 | 0.76 | 0.9 | 0.98 | 1.06 | 1.1 | 1.13 | 0.31 | 0.2933333333 | 0.1966666667 | 0.2566666667 | 0.4116666667 | 0.475 | 0.45 | 0.34 | 0.43 | 0.54 | 0.78 | 1.03 | 1.22 | 1.58 | 1.85 | 2.17 | 2.61 | 2.22 | 2.16 | 2.77 | 3.25 | 3.57 |
| BAE SYSTEMS PLC | 627.72 | 2021 | 8.5 | 9 | 9.2 | 9.2 | 9.5 | 10.3 | 11.3 | 12.8 | 14.5 | 16 | 17.5 | 18.8 | 19.5 | 20.1 | 20.5 | 20.9 | 21.3 | 21.8 | 22.2 | 23.2 | 23.7 | 25 | 26 | 27 | 17.3 | 16.6 | 18.4 | 21.7 | 53.1 | 30.4 | 37 | 40.6 | 42.1 | 45.3 | 38.5 | 41.8 | 37.9 | 40.1 | 40.1 | 41.9 | 42.8 | 50.5 | 46.5 | 43 | 47 | 49 |
| BRITISH AMERICAN TOBACCO PLC | 3,508.07 | 2021 | 29 | 32 | 35.2 | 38.8 | 41.9 | 47 | 55.9 | 66.2 | 83.7 | 99.5 | 114.2 | 126.5 | 134.9 | 142.4 | 148.1 | 154 | 169.4 | 295.3 | 203 | 210.4 | 215.6 | 218 | 228 | 242 | 66.54 | 69.21 | 76.67 | 89.48 | 98.6 | 108.53 | 128.78 | 151.6 | 173.4 | 191.9 | 205.2 | 216.6 | 208.1 | 208.4 | 247.5 | 282.1 | 296.7 | 323.8 | 331.7 | 311 | 333 | 350 |
| BROADCOM INC | 548.67 | 2021 | x | x | x | x | x | x | x | x | x | x | x | 0.35 | 0.56 | 0.8 | 1.13 | 1.55 | 1.94 | 4.08 | 7 | 10.6 | 13 | 14.4 | 16 | 17.1 | x | x | x | x | x | x | x | 0.66 | 2.19 | 2.7 | 2.77 | 2.89 | 4.9 | 8.98 | 11.45 | 16.02 | 20.82 | 21.29 | 22.16 | 15.4 | 18.9 | 21 |
| CELANESE CORP CLASS A | 178.74 | 2021 | x | x | x | x | x | 0.08 | 0.16 | 0.16 | 0.16 | 0.16 | 0.18 | 0.22 | 0.27 | 0.525 | 0.93 | 1.15 | 1.38 | 1.74 | 2.08 | 2.4 | 2.48 | 2.72 | 2.85 | 3.06 | x | x | x | 1.67 | 2.36 | 2.49 | 2.76 | 1.58 | 3.22 | 4.51 | 4.07 | 4.5 | 5.67 | 6.02 | 6.61 | 7.51 | 11 | 9.53 | 7.64 | 16.2 | 14.1 | 16 |
| CORESITE REALTY CORP | 137.57 | 2021 | x | x | x | x | x | x | x | x | x | x | 0.13 | 0.57 | 0.81 | 1.16 | 1.47 | 1.79 | 2.39 | 3.58 | 4.14 | 4.76 | 4.89 | 5.04 | 5.21 | 5.59 | x | x | x | x | x | x | x | x | 0.25 | 1.24 | 1.55 | 1.82 | 2.22 | 2.86 | 3.71 | 4.52 | 5.06 | 5.1 | 5.31 | 2.04 | 2.25 | 2.63 |
| DOMINO’S PIZZA INC | 535.73 | 2021 | x | x | x | x | 0.065 | 0.4 | 0.48 | 13.5 | 0 | 0 | 0 | 0 | 3 | 0.8 | 1 | 1.24 | 1.52 | 1.84 | 2.2 | 2.6 | 3.12 | 3.76 | 4.23 | 4.83 | x | x | 1.12 | 1.43 | 1.56 | 1.03 | 0.75 | 0.87 | 1.35 | 1.69 | 2.02 | 2.45 | 2.9 | 3.45 | 4.3 | 5.91 | 8.42 | 9.57 | 12.01 | 13.7 | 15.7 | 18 |
| ENAGAS SA | 18.58 | 2021 | x | x | 0.23053 | 0.29744 | 0.331175 | 0.399944 | 0.471809 | 0.598874 | 0.650641 | 0.749027 | 0.83812325 | 0.99280956 | 1.1127683 | 1.26662715 | 1.3 | 1.32 | 1.39 | 1.46 | 1.53 | 1.6 | 1.68 | 1.7 | 1.67 | 1.68 | 0.46 | 0.59 | 0.662318731 | 0.799886066 | 0.906381161 | 0.9981 | 1.0844 | 1.2484 | 1.3969 | 1.5274 | 1.5897 | 1.6888 | 1.7029 | 1.7285 | 1.7499 | 2.0587 | 1.8546 | 1.7688 | 1.698 | 1.49 | 1.47 | 1.43 |
| ENBRIDGE INC | 55.11 | 2021 | 0.3175 | 0.35 | 0.38 | 0.415 | 0.4575 | 0.51875 | 0.575 | 0.615 | 0.66 | 0.74 | 0.85 | 0.98 | 1.13 | 1.26 | 1.4 | 1.86 | 2.12 | 2.413 | 2.684 | 2.952 | 3.24 | 3.34 | 3.48 | 3.61 | 0.67 | 0.75 | 0.735 | 0.795 | 0.87 | 0.895 | 0.94 | 1.175 | 1.3 | 1.44 | 1.61 | 1.78 | 3.02 | 3.72 | 4.08 | 3.68 | 4.42 | 4.57 | 4.67 | 2.82 | 3.05 | 3.15 |
| ENERGY TRANSFER LP | 14.44 | 2021 | x | x | x | x | x | x | 0.23695 | 0.417125 | 0.4775 | 0.53375 | 0.54 | 0.60875 | 0.6275 | 0.66625 | 0.801875 | 1.08 | 1.14 | 1.17 | 1.22 | 1.22 | 0.915 | 0.61 | 0.63 | 0.69 | x | x | x | x | 0.1975 | 0.3875 | 0.4844411494 | 0.5528745784 | 0.5567231382 | 0.5710285824 | 0.6251827043 | 0.64 | 0.82 | 1.24 | 1.151602104 | 0.9144871081 | 2.05810491 | 2.376712329 | 2.129025078 | 2.08 | 1.38 | 1.48 |
| ENTERPRISE PRODUCTS PARTNERS LP | 28.19 | 2021 | 0.525 | 0.596875 | 0.68 | 0.735 | 0.77 | 0.84875 | 0.9125 | 0.97375 | 1.0375 | 1.0975 | 1.1575 | 1.2175 | 1.28625 | 1.37 | 1.45 | 1.53 | 1.61 | 1.6825 | 1.725 | 1.765 | 1.785 | 1.81 | 1.83 | 1.89 | 0.6447121728 | 0.6090425769 | 0.828349603 | 1.066673167 | 1.028606493 | 1.00387812 | 1.393466101 | 1.346799141 | 1.511199811 | 2.259196913 | 2.388982233 | 2.087430058 | 2.184759074 | 2.825510978 | 1.946412458 | 2.083869463 | 2.735377963 | 3.00776154 | 2.912235644 | 2.19 | 2.17 | 2.3 |
| HANNON ARMSTRONG SUSTAINABLE INFRASTRUCTURE CAPITAL INC | 65.80 | 2021 | x | x | x | x | x | x | x | x | x | x | x | x | x | 0.42 | 0.92 | 1.08 | 1.23 | 1.32 | 1.32 | 1.34 | 1.36 | 1.4 | 1.47 | 1.55 | x | x | x | x | x | x | x | x | x | x | x | 0.43 | 0.93 | 1.04 | 1.2 | 1.27 | 1.38 | 1.4 | 1.55 | 1.3 | 1.07 | 1.35 |
| HENKEL AG & CO KGAA | 94.75 | 2021 | 0.3533333333 | 0.3533333333 | 0.3533333333 | 0.38 | 0.4133333333 | 0.4333333333 | 0.48 | 0.51 | 0.51 | 0.51 | 0.7 | 0.78 | 0.93 | 1.2 | 1.29 | 1.45 | 1.6 | 1.77 | 1.83 | 1.83 | 1.83 | 1.85 | 1.93 | 2 | 1.323333333 | 1.426666667 | 1.726666667 | 1.75 | 1.973333333 | 2.17 | 2.17 | 1.89 | 2.8 | 3.12 | 3.61 | 4.05 | 4.36 | 4.86 | 5.34 | 5.83 | 5.99 | 5.41 | 4.24 | 4.18 | 4.69 | 5.1 |
| IMPERIAL BRANDS PLC | 1,953.71 | 2021 | x | x | x | x | x | x | x | x | 42.2 | 73 | 84.3 | 95.1 | 105.6 | 116.4 | 128.1 | 141 | 155.2 | 170.72 | 187.79 | 206.57 | 137.71 | 141 | 145 | 151 | x | x | x | x | x | x | 136.4 | 161.4 | 178.3 | 187.4 | 200.4 | 210.1 | 202.8 | 211.9 | 248.9 | 266.4 | 271.3 | 271.8 | 254.1 | 235 | 188 | 204 |
| INDUSTRIA DE DISENO TEXTIL SA | 32.13 | 2021 | x | 0.022 | 0.028 | 0.07 | 0.096 | 0.134 | 0.168 | 0.21 | 0.21 | 0.24 | 0.32 | 0.36 | 0.44 | 0.484 | 0.52 | 0.6 | 0.68 | 0.75 | 0.88 | 0.35 | 0.7 | 0.94 | 1.08 | 1.19 | 0.1406 | 0.1432 | 0.2056 | 0.2588 | 0.3226 | 0.4028 | 0.4032 | 0.4228 | 0.5558 | 0.62 | 0.7574 | 0.763 | 0.803 | 0.923 | 1.014 | 1.082 | 1.106 | 1.168 | 0.355 | 1.17 | 1.28 | 1.4 |
| INTER PARFUMS INC | 88.00 | 2021 | x | x | 0.04 | 0.05333333333 | 0.08 | 0.1066666667 | 0.1066666667 | 0.1333333333 | 0.1323333333 | 0.132 | 0.26 | 0.32 | 0.32 | 0.96 | 0.48 | 0.52 | 0.62 | 0.72 | 0.905 | 1.155 | 0.33 | 1 | 1.08 | 1.18 | 0.3133333333 | 0.46 | 0.5133333333 | 0.5 | 0.5733333333 | 0.76 | 0.77 | 0.74 | 0.87 | 1.05 | 4.26 | 1.27 | 0.95 | 0.98 | 1.07 | 1.33 | 1.71 | 1.9 | 1.21 | 1.95 | 2.26 | 2.26 |
| INTERNATIONAL FLAVORS & FRAGRANCES INC | 162.95 | 2021 | 1.29 | 0.6 | 0.6 | 0.63 | 0.685 | 0.73 | 0.765 | 0.88 | 0.96 | 1 | 1.04 | 1.16 | 1.3 | 1.46 | 1.72 | 2.06 | 2.4 | 2.66 | 2.84 | 2.96 | 3.04 | 2.96 | 3.15 | 3.43 | 1.92 | 2.12 | 2.27 | 1.94 | 2.32 | 2.66 | 2.76 | 2.69 | 3.37 | 3.74 | 3.98 | 4.46 | 5.08 | 5.25 | 5.51 | 6.23 | 6.23 | 6.17 | 5.7 | 1.25 | 3.61 | 4.55 |
| INTERTEK GROUP PLC | 5,657.37 | 2021 | x | x | 5.2 | 8.8 | 10.4 | 12 | 14.8 | 18 | 20.8 | 25.5 | 28.1 | 33.7 | 41 | 46 | 49.1 | 52.3 | 62.4 | 71.3 | 99.1 | 105.8 | 105.8 | 108 | 113 | 121 | 26.9 | 29.7 | 34.3 | 39.1 | 43.2 | 48.8 | 67.1 | 81.5 | 89.4 | 107.2 | 131.2 | 138.6 | 132.1 | 140.7 | 167.7 | 191.6 | 198.3 | 212.5 | 170.9 | 171 | 195 | 210 |
| IRON MOUNTAIN INC | 43.14 | 2021 | x | x | x | x | x | x | x | x | x | x | 0.375 | 0.9375 | 5.1215 | 1.08 | 5.3594 | 1.91 | 2.005 | 2.2375 | 2.3735 | 2.4515 | 2.474 | 2.5 | 2.54 | 2.6 | 0.3 | 0.4333333333 | 0.48 | 0.56 | 0.64 | 0.75 | 0.39 | 1.07 | -0.29 | 2.02 | 0.98 | 0.5 | 2.680877666 | 2.552178504 | 2.706556071 | 2.819123461 | 3.009321375 | 3.01 | 3.07 | 1.52 | 1.45 | 1.38 |
| JOHN WILEY & SONS INC CLASS A | 62.33 | 2021 | 0.16 | 0.18 | 0.2 | 0.26 | 0.3 | 0.36 | 0.4 | 0.44 | 0.52 | 0.56 | 0.64 | 0.8 | 0.96 | 1 | 1.16 | 1.2 | 1.24 | 1.28 | 1.32 | 1.36 | 1.37 | 1.38 | 1.54 | 1.38 | 1.41 | 1.35 | 1.85 | 1.71 | 2.49 | 2.15 | 2.41 | 2.8 | 3.12 | 2.92 | 3.05 | 3.26 | 2.7 | 3.01 | 3.43 | 2.96 | 2.4 | 2.92 | 2.98 | 3.11 | ||
| LOWE’S COMPANIES INC | 228.74 | 2021 | 0.035 | 0.03875 | 0.0425 | 0.055 | 0.075 | 0.11 | 0.18 | 0.29 | 0.335 | 0.355 | 0.42 | 0.53 | 0.62 | 0.7 | 0.87 | 1.07 | 1.33 | 1.58 | 1.85 | 2.13 | 2.3 | 3 | 3.21 | 3.57 | 0.93 | 1.13 | 1.35 | 1.73 | 1.99 | 1.86 | 1.49 | 1.21 | 1.42 | 1.43 | 1.69 | 2.14 | 2.71 | 3.29 | 3.99 | 4.39 | 5.11 | 5.74 | 8.86 | 11.3 | 12.1 | 13.9 |
| MAGELLAN MIDSTREAM PARTNERS LP | 51.60 | 2021 | x | 0.5055 | 0.678125 | 0.7925 | 0.880625 | 1.030625 | 1.1675 | 1.27375 | 1.38625 | 1.42 | 1.4775 | 1.585 | 1.87625 | 2.1825 | 2.615 | 3.005 | 3.315 | 3.5875 | 3.87 | 4.065 | 4.11 | 4.11 | 4.13 | 4.17 | 0.9175 | 0.8275 | 0.86 | 1.015 | 1.12 | 1.3 | 1.635 | 1.11 | 1.825633648 | 2.040740183 | 2.391843987 | 2.952532525 | 3.87428056 | 4.143502527 | 4.156980774 | 4.476246406 | 4.85926779 | 5.674255876 | 4.631738824 | 4.2 | 4.19 | 4.58 |
| MASTERCARD INC CLASS A | 433.88 | 2021 | x | x | x | x | x | x | 0.018 | 0.06 | 0.06 | 0.06 | 0.06 | 0.06 | 0.12 | 0.29 | 0.49 | 0.67 | 0.79 | 0.91 | 1.08 | 1.39 | 1.64 | 1.76 | 1.78 | 1.92 | x | x | x | x | 0.337 | 0.758 | 0.941 | 1.119 | 1.405 | 1.87 | 2.204 | 2.61 | 3.1 | 3.43 | 3.77 | 4.58 | 6.49 | 7.77 | 6.43 | 8.28 | 10.6 | 13 |
| MERCK & CO INC | 95.00 | 2021 | 1.26 | 1.38 | 1.42 | 1.46 | 1.5 | 1.52 | 1.52 | 1.52 | 1.52 | 1.52 | 1.52 | 1.56 | 1.69 | 1.73 | 1.77 | 1.81 | 1.85 | 1.89 | 1.99 | 2.26 | 2.48 | 2.59 | 2.81 | 3.03 | 3.14 | 3.03 | 2.61 | 2.1 | 2.03 | 3.2 | 3.42 | 3.25 | 3.42 | 3.77 | 3.82 | 3.49 | 3.49 | 3.59 | 3.78 | 3.98 | 4.34 | 5.19 | 5.94 | 4.74 | 5.98 | 6.47 |
| MICROCHIP TECHNOLOGY INC | 93.06 | 2021 | x | x | 0.02 | 0.0565 | 0.104 | 0.285 | 0.4825 | 0.6025 | 0.673 | 0.6795 | 0.687 | 0.695 | 0.703 | 0.7085 | 0.7125 | 0.7165 | 0.7205 | 0.7245 | 0.7285 | 0.7325 | 0.747 | 0.98 | 1.12 | 1.12 | 0.32 | 0.37 | 0.535 | 0.635 | 0.74 | 0.785 | 0.635 | 0.66 | 1.175 | 0.945 | 0.945 | 1.225 | 1.33 | 1.34 | 1.995 | 2.725 | 3.105 | 2.81 | 3.295 | 2.09 | 2.59 | 2.77 |
| MONCLER SPA | 59.30 | 2021 | x | x | x | x | x | x | x | x | x | x | x | x | x | 0.1 | 0.12 | 0.14 | 0.18 | 0.28 | 0.4 | 0 | 0.45 | 0.55 | 0.67 | 0.75 | x | x | x | x | x | x | x | x | x | x | x | 0.3 | 0.52 | 0.67 | 0.78 | 0.98 | 1.31 | 1.43 | 1.18 | 1.41 | 1.77 | 2.03 |
| NORTHROP GRUMMAN CORP | 404.50 | 2021 | 0.8 | 0.8 | 0.8 | 0.8 | 0.89 | 1.01 | 1.16 | 1.48 | 1.57 | 1.69 | 1.84 | 1.97 | 2.15 | 2.38 | 2.71 | 3.1 | 3.5 | 3.9 | 4.7 | 5.16 | 5.67 | 6.16 | 6.72 | 7.36 | 0.17 | 2.32 | 2.97 | 3.85 | 4.37 | 5.12 | -3.77 | 5.21 | 6.82 | 7.52 | 7.47 | 7.88 | 8.93 | 9.21 | 14.59 | 14.04 | 21.33 | 21.21 | 23.65 | 31.7 | 25.7 | 29.4 |
| NOVARTIS AG | 93.517 | 2021 | 0.85 | 0.9 | 0.95 | 1 | 1.05 | 1.15 | 1.35 | 1.6 | 2 | 2.1 | 2.2 | 2.25 | 2.3 | 2.45 | 2.6 | 2.7 | 2.75 | 2.8 | 2.85 | 2.95 | 3 | 3.02205225 | 3.11446975 | 3.253096 | 1.89 | 1.97 | 2.27 | 2.62 | 3.04 | 5.13 | 4.18 | 4.5 | 5.15 | 5.5 | 5.15 | 5.09 | 5.23 | 4.9 | 4.75 | 4.86 | 5.15 | 5.4 | 5.78 | 4.18651275 | 4.57466625 | 5.05523725 |
| ONEOK INC | 57.48 | 2021 | 0.31 | 0.31 | 0.31 | 0.345 | 0.44 | 0.545 | 0.61 | 0.7 | 0.78 | 0.82 | 0.91 | 1.08 | 1.27 | 1.48 | 2.125 | 2.43 | 2.46 | 2.72 | 3.245 | 3.53 | 3.74 | 3.74 | 3.76 | 3.79 | 0.695 | 0.61 | 1.15 | 2.53 | 1.34 | 1.395 | 1.475 | 1.435 | 1.55 | 1.68 | 1.71 | 1.27 | 2.963833212 | 3.050787791 | 3.220794968 | 3.656199189 | 4.430486936 | 4.88353037 | 4.383960294 | 3.3 | 3.63 | 3.82 |
| ORGANON & CO ORDINARY SHARES | 41.44 | 2021 | x | x | x | x | x | x | x | x | x | x | x | x | x | x | x | x | x | x | x | x | x | 0.56 | 1.27 | 1.28 | x | x | x | x | x | x | x | x | x | x | x | x | x | x | x | x | x | x | x | 5.85 | 7.69 | 5.63 |
| PHILIP MORRIS INTERNATIONAL INC | 111.25 | 2021 | x | x | x | x | x | x | x | x | 1.54 | 2.24 | 2.44 | 2.82 | 3.24 | 3.58 | 3.88 | 4.04 | 4.12 | 4.22 | 4.49 | 4.62 | 4.74 | 4.9 | 5.11 | 5.51 | x | x | x | x | x | x | 3.31 | 3.29 | 3.87 | 4.88 | 5.22 | 5.4 | 5.02 | 4.42 | 4.48 | 4.72 | 5.1 | 5.19 | 5.17 | 5.88 | 6.63 | 7.2 |
| POLARIS INC | 154.64 | 2021 | 0.22 | 0.25 | 0.28 | 0.31 | 0.46 | 0.56 | 0.62 | 0.68 | 0.76 | 0.78 | 0.8 | 0.9 | 1.48 | 1.68 | 1.92 | 2.12 | 2.2 | 2.32 | 2.4 | 2.44 | 2.48 | 2.52 | 2.61 | 2.84 | 1.06 | 1.19 | 1.125 | 1.56 | 1.29 | 1.535 | 1.75 | 1.525 | 2.14 | 3.2 | 4.4 | 5.35 | 6.65 | 6.75 | 3.48 | 5.1 | 6.56 | 6.32 | 7.74 | 9.02 | 9.96 | 9.72 |
| RAYTHEON TECHNOLOGIES CORP | 101.76 | 2021 | x | x | x | x | x | x | x | x | x | x | x | x | x | x | x | x | x | x | x | x | 1.425 | 2.005 | 2.13 | 2.28 | x | x | x | x | x | x | x | x | x | x | x | x | x | x | x | x | x | x | 2.73 | 2.99 | 4.47 | 5.34 |
| RECKITT BENCKISER GROUP PLC | 7,010.10 | 2021 | 25.5 | 25.5 | 25.5 | 28 | 34 | 39 | 45.5 | 55 | 80 | 100 | 115 | 125 | 134 | 137 | 139 | 139 | 153.2 | 164.3 | 170.7 | 174.6 | 174.6 | 175 | 175 | 175 | 55.7 | 66.2 | 77.1 | 90 | 107.1 | 123.4 | 157.8 | 194.7 | 226.5 | 247.1 | 263.3 | 269.8 | 268.5 | 258.6 | 302 | 324.6 | 339.6 | 349 | 327 | -106 | 304 | 325 |
| RED ELECTRICA CORPORACION SA | 16.21 | 2021 | 0.10375 | 0.11375 | 0.12 | 0.137 | 0.15345 | 0.1826 | 0.2246 | 0.271775 | 0.319925 | 0.369525 | 0.468775 | 0.5531 | 0.591275 | 0.63555 | 0.75 | 0.8025 | 0.8587 | 0.9188 | 0.9831 | 1.0519 | 1 | 1 | 1 | 0.92 | 0.185 | 0.215 | 0.2525 | 0.3 | 0.37 | 0.4525 | 0.53 | 0.6125 | 0.725 | 0.855 | 0.915 | 0.98 | 1.3275 | 1.1225 | 1.18 | 1.24 | 1.31 | 1.33 | 1.15 | 1.26 | 1.27 | 1.26 |
| RESTAURANT BRANDS INTERNATIONAL INC | 75.37 | 2021 | x | x | x | x | x | x | x | x | x | x | x | x | x | x | x | 0.44 | 0.62 | 0.78 | 1.8 | 2 | 2.08 | 2.12 | 2.26 | 2.43 | x | x | x | x | x | x | x | x | x | x | x | x | 0.98 | 1.09 | 1.58 | 2.1 | 2.63 | 2.72 | 2.03 | 2.77 | 3.14 | 3.46 |
| ROSS STORES INC | 139.15 | 2021 | 0.019375 | 0.021875 | 0.025 | 0.0321875 | 0.044375 | 0.055 | 0.06375 | 0.08 | 0.09875 | 0.1225 | 0.175 | 0.235 | 0.295 | 0.255 | 0.4 | 0.47 | 0.54 | 0.64 | 0.9 | 1.02 | 0.285 | 1.15 | 1.29 | 2.04 | 0.3125 | 0.3675 | 0.2825 | 0.34 | 0.425 | 0.475 | 0.5825 | 0.885 | 1.1575 | 1.43 | 1.765 | 1.94 | 2.21 | 2.51 | 2.83 | 3.55 | 4.26 | 4.6 | 0.24 | 4.53 | 5.38 | 5.92 |
| SANOFI SA | 104.78 | 2021 | 0.44 | 0.66 | 0.84 | 1.02 | 1.2 | 1.52 | 1.75 | 2.07 | 2.2 | 2.4 | 2.5 | 2.65 | 2.77 | 2.8 | 2.85 | 2.93 | 2.96 | 3.03 | 3.07 | 3.15 | 3.2 | 3.29 | 3.47 | 3.6 | 2.42 | 2.95 | 3.88 | 4.74 | 5.23 | 5.24 | 5.59 | 6.61 | 7.06 | 6.62 | 6.14 | 5.05 | 5.2 | 5.64 | 5.68 | 5.52 | 5.47 | 5.99 | 5.86 | 4.77 | 5.7 | 6.27 |
| ST JAMES’S PLACE PLC | 1,645.40 | 2021 | 2.25 | 2.75 | 2.75 | 2.75 | 2.85 | 3.15 | 10 | 4.3 | 4.39 | 4.5 | 6 | 8 | 10.64 | 15.96 | 23.3 | 27.96 | 33 | 42.86 | 48.22 | 49.71 | 38.49 | 50 | 57 | 64 | -5.9 | 1.5 | 2.6 | 8.2 | 16.9 | 16.1 | 14.1 | 8.2 | 11.2 | 21.2 | 21.2 | 27 | 33.2 | 34.2 | 37.9 | 52.7 | 57.8 | 51.1 | 49.1 | 56 | 68 | 79 |
| STANLEY BLACK & DECKER INC | 236.36 | 2021 | 0.9 | 0.94 | 0.99 | 1.03 | 1.08 | 1.14 | 1.18 | 1.22 | 1.26 | 1.3 | 1.34 | 1.64 | 1.8 | 1.98 | 2.04 | 2.14 | 2.26 | 2.42 | 2.58 | 2.7 | 2.78 | 2.98 | 3.16 | 3.35 | 2.1 | 1.27 | 4.36 | 3.16 | 3.46 | 3.95 | 3.84 | 2.79 | 3.54 | 4.65 | 4.72 | 4.98 | 5.67 | 5.92 | 6.53 | 7.46 | 8.15 | 8.4 | 9.04 | 11 | 12.2 | 13.2 |
| STARBUCKS CORP | 129.85 | 2021 | x | x | x | x | x | x | x | x | x | x | 0.18 | 0.28 | 0.36 | 0.445 | 0.55 | 0.68 | 0.85 | 1.05 | 1.32 | 1.49 | 1.68 | 1.84 | 1.96 | 2.19 | 0.13 | 0.165 | 0.235 | 0.305 | 0.355 | 0.435 | 0.355 | 0.4 | 0.615 | 0.76 | 0.895 | 1.095 | 1.33 | 1.58 | 1.85 | 2.06 | 2.42 | 2.83 | 1.17 | 3.09 | 3.64 | 4.12 |
| TENCENT HOLDINGS LTD | 645.94 | 2021 | x | x | x | x | 0.014 | 0.016 | 0.024 | 0.032 | 0.07 | 0.08 | 0.11 | 0.15 | 0.2 | 0.24 | 0.36 | 0.47 | 0.61 | 0.88 | 1 | 1.2 | 1.6 | 1.936485072 | 2.118030548 | 2.517430594 | x | 0.0488 | 0.0568 | 0.0534 | 0.117 | 0.1706 | 0.3028 | 0.5582 | 0.8656 | 1.098 | 1.3666 | 1.6596 | 2.589 | 3.437 | 4.784 | 6.83 | 8.097 | 9.729 | 12.689 | 18.63866882 | 20.33309326 | 24.44812403 |
| TEXAS INSTRUMENTS INC | 204.96 | 2021 | 0.085 | 0.085 | 0.085 | 0.085 | 0.08875 | 0.105 | 0.13 | 0.3 | 0.41 | 0.45 | 0.49 | 0.56 | 0.72 | 1.07 | 1.24 | 1.4 | 1.64 | 2.12 | 2.63 | 3.21 | 3.72 | 4.21 | 4.59 | 4.98 | -0.2 | 0.68 | 1.05 | 1.39 | 2.78 | 1.83 | 1.44 | 1.15 | 2.62 | 1.88 | 1.51 | 1.91 | 2.57 | 2.82 | 3.48 | 3.61 | 5.59 | 5.24 | 5.97 | 7.9 | 8.18 | 8.47 |
| THE HOME DEPOT INC | 347.68 | 2021 | 0.16 | 0.17 | 0.21 | 0.26 | 0.325 | 0.4 | 0.675 | 0.9 | 0.9 | 0.9 | 0.945 | 1.04 | 1.16 | 1.56 | 1.88 | 2.36 | 2.76 | 3.56 | 4.12 | 5.44 | 6 | 6.6 | 7.15 | 7.61 | 1.56 | 1.88 | 2.26 | 2.72 | 2.79 | 2.37 | 1.34 | 1.57 | 2.01 | 2.47 | 3 | 3.76 | 4.71 | 5.46 | 6.45 | 7.29 | 9.73 | 10.25 | 11.94 | 14.6 | 15.1 | 16 |
| TJX COMPANIES INC | 83.50 | 2021 | 0.02 | 0.0225 | 0.03 | 0.035 | 0.045 | 0.06 | 0.07 | 0.09 | 0.11 | 0.12 | 0.15 | 0.19 | 0.23 | 0.29 | 0.35 | 0.42 | 0.52 | 0.625 | 0.78 | 0.92 | 0.26 | 1.04 | 1.16 | 1.29 | 0.245 | 0.29 | 0.3025 | 0.3525 | 0.3875 | 0.415 | 0.5 | 0.71 | 0.825 | 0.965 | 1.275 | 1.47 | 1.575 | 1.665 | 1.73 | 2.02 | 2.43 | 2.67 | 0.07 | 2.81 | 3.34 | 3.71 |
| UNILEVER PLC | 52.115 | 2021 | 0.4766666667 | 0.5366666667 | 0.5666666667 | 0.58 | 0.63 | 0.66 | 0.96 | 0.75 | 0.77 | 0.465 | 0.832 | 0.9 | 0.972 | 1.076 | 1.14 | 1.208 | 1.2804 | 1.434 | 1.5488 | 1.6416 | 1.658 | 1.7085785 | 1.7792783 | 1.885328 | 0.6933333333 | 0.9133333333 | 0.86 | 1.19 | 1.52 | 1.23 | 1.68 | 1.16 | 1.31 | 1.37 | 1.53 | 1.69 | 1.73 | 1.93 | 2.03 | 2.23 | 2.35 | 2.55 | 2.48 | 2.2270437 | 2.4037932 | 2.6630258 |
| UNITEDHEALTH GROUP INC | 459.20 | 2021 | 0.00375 | 0.0075 | 0.0075 | 0.0075 | 0.015 | 0.015 | 0.03 | 0.03 | 0.03 | 0.03 | 0.405 | 0.6125 | 0.8 | 1.0525 | 1.405 | 1.875 | 2.375 | 2.875 | 3.45 | 4.14 | 4.83 | 5.6 | 5.8 | 6.23 | 0.95 | 1.34 | 1.83 | 2.31 | 2.97 | 3.42 | 2.4 | 3.24 | 4.1 | 4.73 | 5.28 | 5.83 | 6.04 | 6.45 | 8.05 | 10.07 | 12.88 | 15.11 | 16.88 | 17.9 | 20.6 | 23.4 |
| VF CORP | 91.18 | 2021 | x | x | x | x | x | x | x | x | x | x | x | x | x | x | x | x | x | x | x | 1.39 | 1.94 | 1.97 | 2.04 | 2.09 | x | x | x | x | x | x | x | x | x | x | x | x | x | x | x | x | x | 1.7 | 1.04 | 3.41 | 3.73 | 4.25 |
| WESTERN MIDSTREAM PARTNERS LP | 24.93 | 2021 | x | x | x | x | x | x | x | x | x | x | x | x | 0.03587 | 0.82125 | 1.125 | 1.49125 | 1.7675 | 2.105 | 2.34875 | 2.47 | 1.244 | 1.29 | 1.36 | 1.43 | x | x | x | x | x | x | x | x | x | x | 0.03587091587 | 0.8210794167 | 1.128153122 | 1.493867427 | 1.753871242 | 2.107960956 | 2.344534476 | 3.187744412 | 2.817329195 | 2.24 | 2.63 | 2.85 |
14 Me gusta
Vash ha invertido en China. ![]()
![]()
![]()
Y ya casi tiene 60 posiciones en la cartera.

3 Me gusta
En breve tendre 500 ![]()
3 Me gusta
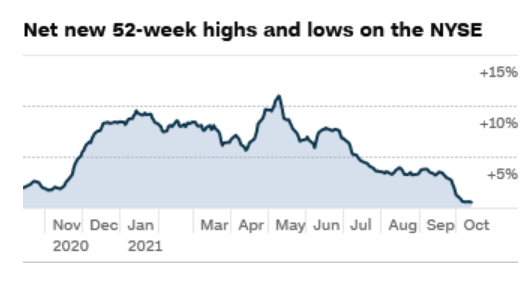
Una grafica sorprendente para un indice que no deja de batir maximos
No es igual, es mas importante
Cuando viene una gorda, y todo baja, tener unos ingresos pasivos que aunque bajen, no en la misma proporcion te da mucha tranquilidad y evita hacer tonterias
Al menos es mi expericiencia.
70% acciones, 30 cash, 0 fondos (Solo el PP de Bestinver)
2 Me gusta