Ted SeeksQuality

"We have gone through a decade of rapid dividend growth, so past-looking metrics will all look brilliant, but I would work from the assumption that dividend growth over the next decade will be lower.

Longer term, all else equal, income growth will be the same as total return. The difference between the two is expressed in the various ratios, including payout ratio, dividend yield, and PE valuation. Right now payout ratios are on the high side and valuations are also on the high side, so I would anticipate that both income growth and total return will be lower than normal over the next decade.

Historic equity returns have been in the 9% to 11% range. Going forward, with a typical DGI portfolio, I would look for returns in the 8% to 10% range. And perhaps a notch below that over the next decade. That is assuming reinvestment of dividends, but no new money."

6 Me gusta

Una de matemáticas.
Le preguntaron cómo calcular los objetivos para una cartera DGI: (Del sueldo, ni hablamos)

"I am going to stick my neck out and let everyone knows that I suck at math words problems (throw me tomatoes is ok too), and I need help understand with what you are saying. I understand the incomes objective now, but I am not clear how you are using this formula and maybe this will also help young folks to understand more.

So let’s say my income right now is $190K-$200K. I am making more in 3 to 5 years and I think my salary would cap at around $300K. I want to retire in 20 years with the $200K annual income. My 401K portfolio is currently at $300K. Possible to get there? What types of yield growth % number I need to look at? Only divs stocks? Growth stocks too? Need that crystal clear picture and right now it is just all over the place"

Su respuesta:

"You give your current portfolio as $300k and your target as $200k annual income in 20 years. One is talking portfolio value, the other is talking annual income, so I will translate the latter into “like terms” by assuming a 4% yield. Your target portfolio in 20 years is thus $5M.

Now there are many ways to get to $5M, involving different levels of savings and different growth rates. The simplest way is to use the Excel spreadsheet calculation FV (stands for "future value):

=FV(RATE, PERIODS, SAVINGS, PRESENT-VALUE)

Let’s plug in 20 years and $300k as givens:
=FV(RATE, 20, SAVINGS, 300)

The RATE in this case would be the total return on the portfolio. If you were using this calculation to project income, it would be the income growth rate including reinvestment of dividends. For a default I will use 10%, even though I feel that may be on the high side.

The SAVINGS in this case would be the annual contributions to the 401k. If you were using this calculation to project income, it would be the new dividends purchased with those contributions. For starters I will use $50k/year.

Thus: =FV(0.10, 20, 50, 300) comes to a future value of $4882k or $4.9M. That isn’t quite your $5M target, but it is close enough. (Remember that the error bars on these future projections are LARGE.) So there’s a plan for you. Save an additional $50k per year in your 401k and grow the money at 10% annually for 20 years, and you will hit your target.

The problem is that there isn’t much we can do to control the total return on the portfolio. It will be whatever the market chooses to deliver, and if we try to make moves to juice the returns, it is very likely that we will end up destroying them entirely. So let’s assume a more moderate 8% rate of return?

=FV(0.08, 20, 50, 300) = $3.7M, only 3/4 of your goal…
=FV(0.08, 20, 80, 300) = $5.1M, meeting your goal…

Thus if the market delivers steady 8% returns over the next 20 years, you need to save $80k/year of new money to achieve your target. I’m not sure how much you are allowed to put into the 401k, so some of this might need to be in a taxable account.

High quality DGI stocks are some of the best and most certain long-term performers in the market. It is very hard to beat the long-term returns of dividend aristocrats, and most people who try are going to end up losing money by their attempts to trade. I believe you should be looking at growth rates in addition to current yield, as a 20 year time frame is decently long, but you will likely be happiest if you focus on the portfolio income – and it doesn’t make a difference to my recommendations.

Some questions for you to consider…
(1) Can you achieve that $80k/year new savings within five years? An accelerated savings plan is your best and most certain bet to achieve high targets.

(2) Can you achieve and sustain $50k/year new savings? I believe you have a decent chance of achieving your goals with that, if the markets cooperate. Your best bet of making your target with this reduced savings rate would be a major bear market and slow price recovery, a long period of lower valuations. Most of your future portfolio has yet to be saved and invested, so lower prices today are GOOD for your purposes.

(3) If your savings rate falls short of that $50k figure, or the market returns fall short of the 10% default assumption, where would you compromise? Would you delay retirement a few more years? Accept a $150k retirement income instead of the $200k target? You want to have a “Plan B” in place ahead of time rather than trying to figure one out in the middle of a market crash."
6 Me gusta

Muy buenos el hilo de Chowder y este de Ted.
Muy razonables y se centran el lo importante. Ahorrar, comprar bien, crecer cartera…

Ademas muchos olvidan que el proceso natural de una empresa no es el precio, o especular con el, es ganar dinero y repartir una parte a sus accionistas (y/o crecer si pueden maximizar ese dinero). Y vuelta a empezar.

8 Me gusta

" Fortunes are made in bear markets, not in bull markets… Bear markets represent opportunity, bull markets represent risk.The cheap money that @jvincen2 refers to is a piece of this. There have been countless credit cycles throughout history, and they all end badly. I’m not talking “temporary share price decline” badly, I’m talking real economic retraction, disruption, and failures. The cheap money is like deep water, you have no idea who is swimming naked until the tide goes back out.Thus I am doing my best to stick to the highest quality, as I have been for the last few years. There will be far broader opportunities available when things eventually turn, and much less risk."
[…]
“Companies generate cash from their operations. That cash can be used to fund organic growth, dividends, acquisitions, and share buybacks. Dividend reinvestment, acquisitions, and share buybacks are all more effective at generating compounding when the market is at lower valuations.
The real compound return of a portfolio can be approximated by the earnings yield. (This breaks down at the individual company level and for shorter periods of time, it is more a general approximation.) At a PE of 16, you might enjoy 6% real compound returns above and beyond inflation. At a PE of 25, that falls to 4%. That’s the difference between an investment doubling every 12 years, and one doubling every 18 years. The difference between a 8x multiple over 36 years and a 4x multiple.
The exact numbers are a bit fuzzy, and may drift over time. It isn’t a strict mathematical relationship as there are other factors involved. But the principle is pretty clear. Investors in the accumulation phase should definitely welcome lower market valuations. Those living off dividends but not selling shares are better off with lower market valuations. Only those who are selling down their portfolio want the market to be high.”

4 Me gusta

“If you recall, Robert Schwartz wrote an article illustrating how T would be a great long-term DGI investment even if the shares never appreciated a penny. The article wasn’t really about T (at least I don’t think it was), and the basic assumptions were pretty extreme, but I believe it was an attempt to illustrate the fundamental principle that I was trying to explain. Investments compound faster at low valuations than at high valuations.
It is tricky to illustrate this numerically without a (large) spreadsheet calculation, since it involves not just the initial investment but also the sequence of dividends received. Each which gets reinvested at whatever hypothetical price you assume. But it all boils down to dividends and share count. Your dividend payment buys more shares when prices are low, and thus share count increases more rapidly in that scenario. As the share count increases, the dividends received also increase. The longer that valuations stay low, the more shares you end up with at the end and thus the greater dividends you end up with at the end.
The ideal situation is a strong dividend that increases steadily while the share price remains low. The next best situation is a strong dividend that increases steadily while the share price increases apace the dividend. But if the share price increases faster than the dividend increases, then each dividend reinvestment purchases fewer new shares than the one before it. My kids have observed this in their own investments and independently reached the same conclusion – higher share prices aren’t ideal for a long-term investor trying to accumulate share count and dividend income.
I should really stop complaining about this, for two reasons. First, I’m not suggesting that anybody alter their investment plan, so I need to accept whatever the market chooses to deliver. Right now the market is sending higher prices. Second, dividend increases have continued to be quite strong (boosted by the corporate tax cut), so yields are actually holding up decently well. And strong performance is good for everybody.
And yes, the market isn’t a monolith. If your financial plan permits, you may find good values in some of the Sensitive sectors. I know what I want my own portfolio to look like, so I can only take limited advantage of those values, but others have greater flexibility and will benefit from that.
However you choose and however you proceed, I wish you all the best!”

5 Me gusta

“a good question about the buying process. I am not presently looking to add, because my equity allocation is already maxed. It was maxed at the end of May, and the market has only moved higher since. But if I were…
I would begin by looking at my sector allocation: 9% Real Estate, 8% Utilities, 18% Staples, 20% Health Care, 11% Discretionary, 17% Industrial, 13% Technology, 2% Financial, 1% Energy/Resources. (Those last two are intentionally small, as I have little/no interest in the sectors.)
I account for Real Estate and Utilities separately from the rest, so it would never be a choice between one or the other. Either I add to Real Estate, or I add to Utilities, or I add to something different.
I would love to bring that Staples allocation back up to 20%, my nominal target, so I would begin by looking at the valuations in that sector. Using Google Sheets, filter for my existing positions and for Consumer Staples sector, and… Ugh. GIS does not meet my quality criteria for a long-term position. Aside from that, I’m looking at 4% or weaker forward returns. I’m holding at these levels, but reluctant to buy. Releasing the “presently owned” filter doesn’t help. There aren’t any companies that I don’t already own which I would want to buy at these levels.
SYY is an option. It is fully valued, but not completely unreasonable at these levels. It isn’t EXACTLY a Consumer Staples, but it is only a 3% position. I could bump that up to 4%, which would absorb a few dollars.
Of course I could also look at other sectors. I’m not interested in further increasing Industrials (it is already above my 15% nominal target). Healthcare offers a few possibilities, though CVS is already maxed and I’ve decided to limit my exposure to pharma. JNJ is looking good, though it is very tough to add to what is already a 9% position!!! Tech? I’ve already maxed those positions that look good here.
So I might sort by position size. GIS? DEO? PFE? Nope. XOM? Yeah, maybe, could shove a few more dollars that way. GWW? Have capped the Industrials. NVS? Exiting that one. And so on and so forth… The positions that have been left small are there for a reason (and that list is already getting into the 2% positions).
So if I were to add today, I would probably go with SYY. But because the market is up, my allocation targets are calling for trims rather than buys. Thus this happily remains a hypothetical scenario.”

4 Me gusta

The higher quality defensive holdings have appreciated to the point where they are a questionable value, at the same time that DGR has slowed. For example, PG hasn’t had a dividend increase greater than 4% since 2014, yet is trading at a 2.5% yield and ~24x current year operating earnings.
Thus people are looking elsewhere for value, in Sensitive and Cyclical sectors, at companies with sketchier dividend histories, at CEFs that juice the distribution with leverage and/or capital gains, and so on. Nothing wrong with any of that if it fits your investment plan, but we also need to step back for a moment and ask if it REALLY fits our investment plan?
Is my portfolio riskier than it was last year, three years ago, or five years ago? If so, is this a conscious decision to accept a little more risk? Or the more insidious “quality creep” in which strong investments are being replaced by ones that are “almost as good”?
I have personally chosen to increase the quality of my portfolio over the last few years, and nothing that has transpired has caused me to regret or reverse that decision. If that means I am limited to buying overvalued companies, then so be it. I know what I want my portfolio to look like, and put that ahead of valuation.
And yes, it helps that I am on track to achieve my goals with a healthy margin of safety. Given how generous the markets have been in recent years, I suspect many of you are in a similar situation. If so, do you need to extend risk to achieve your goals? Or will you be fine with the tried-and-true Dividend Aristocrats that should form the heart of any DGI portfolio?
Not pointing fingers here, just offering some food for thought…”

4 Me gusta

"Many people (especially the detractors) miss a basic fact about Valuation – it is inherently a comparison tool. It doesn’t tell you whether a company is doing well or struggling. It isn’t intended to tell you whether the shares will go up or down over the next six months. It skims over questions of quality. All of that said, it gives you a basis for comparing Company A to Company B.

Four years ago, in June and July of 2015, I built a position in BDX. A large position. Aside from a minor trim, those shares were sold between November 2017 and January 2018. The immediate driver of the sale was a decline in credit quality, due to the aggressive acquisitions. Yet valuation also played a role – I could see that BDX was trading at a premium to alternatives such as MDT.

I built a position in MDT between August 2017 and October 2017. A large position, which I still hold today. At that time it was very much attractively valued.

Valuation allowed me to compare the two and determine that MDT could be had more cheaply than BDX. It may have been one step in the comparison, but it certainly wasn’t the alpha and omega! Which company’s business do I prefer? Which is better positioned for growth? How does the quality compare? How does the dividend compare?

Both are good companies, which is why I have owned both at different times. Both are companies I would be willing to own again under the right circumstances. Valuation did not tell me whether BDX was going to go up or down after I sold it. Valuation didn’t tell me how well they were going to execute on the acquisitions, or how rapidly they would be able to pay down the debt. In fact BDX has done pretty well, as you would expect from their history. Their debt is on the way back down and the acquisitions have been positive.

But MDT has also done well, as you would expect from their history. And because my acquisition of MDT was at a better value than my sale of BDX, the trade has worked out well for me.

If used appropriately, Valuation can help you make good choices between competing alternatives. Just understand what you are comparing. In this case I was comparing two similar companies, both quality, at the same time and in the same market environment. Some people also use historical valuation tools, but those can be tricky. You can determine that a stock is more expensive than it has been in the past (the MMM peak showed up very clearly on this basis), but sometimes there are good reasons for that. If a stock is cheaper than it has been in the past, there are often REALLY GOOD reasons why people are losing interest in the company. In neither case is a reversion to the mean guaranteed.

Making a real-time comparison between two companies is a much easier task. That comes down to, “Which horse do I want to ride over the coming years?”"

3 Me gusta

Malos resultados de DIS.
Hoy -5%.

"To me, at least, there were two major takeaways…

First, traffic has been initially light at the new Star Wars theme park. Both Disney and local hotels were more concerned that demand would exceed capacity, and thus held back on both advertising and discounting. The end result was comparatively thin attendance. I’m not concerned, they will figure this one out in time. Always hard to judge initial demand!

Second, they are investing heavily in content and infrastructure for Disney+, which will be launching in three months. I expect Disney+ to be HUGE, bigger than Netflix, but obviously it won’t be making any money until it launches. It likely won’t turn a profit for a couple years after that. This is an investment in the future.

Finally, it is still trading at more than 20x forward earnings. People got a little silly following the Disney+ announcement, and now the reality strikes – that bright future is still a couple years away AS WE KNEW IT WOULD BE FROM THE START! So it isn’t so much the results that were disappointing, in my opinion, as it is that they refocused people from the future vision back to the present.

I trimmed (slash and burn?) my position back in April at $133. If it retreats into the teens, then I will likely extend again. Alternatively, if it holds in the $130s for another year, I will extend at that time. It remains a conviction position, just overvalued."

1 me gusta

As you might know, I have been managing four different substantial portfolios (not counting kids) in addition to my own. While our money is fully invested, with relatively little new cash being added, the other four portfolios are being built out steadily. Three of them make regular monthly purchases. They all are managed with a focus on quality and total return, though one of them (in addition to my own) also emphasizes dividends. Thus I am often screening for stocks that seem to be a good buy. At this time, my screen is tossing up the following ideas. (In some cases the screen hasn’t been updated for a quarter or two, but that is rarely fatal for the universe of stocks that I work with.

Health Care: WBA, CVS, MRK, UNH, AMGN, JNJ, PFE

Eh… I really like what CVS is doing, less so WBA, but these are weaker quality than my usual preference. They offer a pretty compelling valuation (dividend yield is of course one form of valuation), but I don’t want to overextend on these. I have a 4% CVS position (likely will trim that back to 3% soon), another portfolio owns smaller positions in both.

MRK, AMGN, and PFE are all pharma, facing similar political risk. I like the companies, the value, and the dividends, but my screen probably overrates them. I own all three. Another portfolio has a small position in MRK. Caveat emptor.

UNH is a new add for me, also added in another portfolio. Seems a high-quality company, and I am less concerned with the political risk there than I am with prescription drug pricing.

JNJ is by far the strongest company of the seven. I don’t have any special insight on the liability risk, but every analysis that I’ve seen has reached the same conclusion – even in a worst-case scenario it does not significantly damage the financial position or future earnings of the company. In my opinion the liability risk is already priced into the stock. JNJ is owned in every portfolio.

T is a utility morphing into a media giant. I am intrigued by their business plan, and they seem to be executing it well at this point, but they have a long way to go. Own T in my own account, two of the portfolios I advise, and one of the kids’ accounts.

LOW promises strong growth at a reasonable valuation, but they’ve been struggling to deliver. I see them as the #2 (behind HD) in a sector that I don’t especially love. It is owned in one of the portfolios I advise, but I switched boats to HD last year when it went on sale.

JPM and AXP are two high-quality financials. I don’t personally have much in that sector, but have been recently advising smaller JPM positions in three of the portfolios, and have older AXP positions in two of the portfolios. AXP doesn’t pay much of a dividend yield at this point, which makes it less interesting for new purchases.

ETN, UNP, UTX, and UPS screen well among the Industrials. My favorites are UNP and UTX, and each is owned in multiple portfolios. UPS screens well, but it has screened well for years now, and has struggled to deliver. Owned in two portfolios. ETN looks good on paper, and pays a sweet dividend, but it doesn’t live up to the scale or moat of the others. I own it myself but have been hesitant to advise it to others.

Tech is one of my favorite sectors right now, as the valuations are not unreasonable and the sector is still seeing real growth (unlike most other sectors that are revenue-challenged recently). IBM, CSCO, INTC, and AAPL all screen well, though the latter two are probably approaching fair value at this point.

I really like CSCO for the dividend, valuation, and market position in that sector. I do not own IBM and would not recommend it to anybody at this point, as I believe they are badly mismanaged. Still following it, though, out of morbid curiosity. If they ever do right the ship, you will have a strong GROWING dividend. But first they need to right that ship.

9 Me gusta

“FASTgraphs is a valuation tool, and has to be used with the usual cautions that apply to any valuation tool.
Microsoft is definitely trading above historic valuations, but that is because it is presently in the middle of a growth spurt. Looking at the Key Ratios page on Morningstar, it appears that from 2016-2017, the 10-year revenue growth was in the 5% to 7% range. Yet FY18 saw a 22% jump in revenue, followed by a 14% increase in 2019, and projected ~14% growth going forward over the next few years. Needless to say, a company seeing 14% growth will trade at a higher valuation than one seeing 6% growth.
Look at it another way? If the consensus estimates (pulled August 12) are met, then MSFT is trading at 22x its calendar year 2021 earnings. That is expensive! Yet HRL and PEP are trading at 21x earnings, and looking at just mid-single-digit earnings growth. It won’t take long for MSFT earnings to catch up if it continues to grow like this.
The reasons for paying a premium price for HRL and PEP are Defense (neither is likely to be adversely affected by a recession) and dividends (PEP has a much higher payout). The reason for paying a premium price for MSFT is the astounding growth from a high-quality wide-moat giant.
Consider in the context of your strategy and you will know what to do. But if you are considering MSFT, you need to also have conviction that they will meet these aggressive operating estimates. If their growth flags over the next few years, it will not be a good investment at this price.”

2 Me gusta

Lo curioso es lo poco que sube el dividendo

2 Me gusta

De momento se mantiene en el doble dígito (este año 11%).
Aunque si la comparas con UNH, APH, ITW, TXN, HD, ABBV, está claro que no llega al 15% que pides.
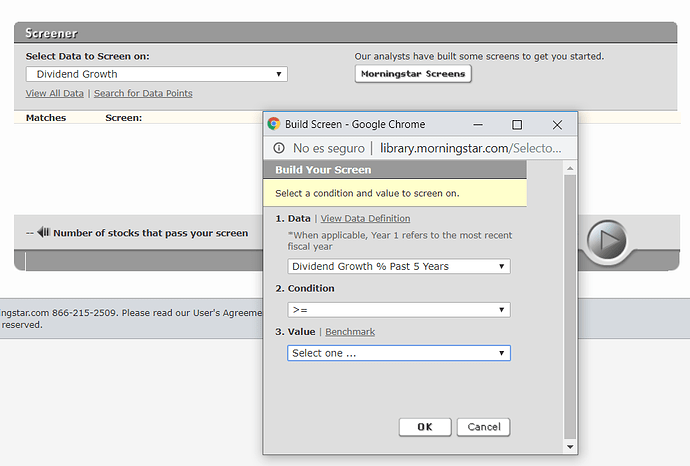
¿Tiene M* un screener para búsqueda de acciones en función del crecimiento de dividendo?.

1 me gusta

Haberlo, haylo

Siempre puedes filtrar en el Excel de David Fish.

Así hago, pero estoy valorando sitios de suscripción y por eso preguntaba.
Como es el que menos he manejado para búsqueda de información, M* me resulta bastante opaco.
SSD tiene un buen screener, pero está limitado a USA y vale una leña.

La diferencia entre “defensive” y “quality” usando SJM como ejemplo

I’m probably going to ruffle some feathers with this, but will go ahead and say it anyways…
People often misunderstand the difference between Defense and Quality, and attribute a Moat to companies that in my opinion have little or none.

The difference between a Defensive stock and a Sensitive stock has to do with how the earnings respond to macroeconomic conditions. Consider UTX, for example? Earnings fell from $4.90 to $4.12 between 2008 and 2009. Cash flow fell from $6.38 to $5.43. (All numbers from ValueLine.) Or CSCO? Earnings fell from $1.31 to $1.05 while cash flow fell from $1.66 to $1.37. These are strong companies that were never endangered by that drop in earnings, and they recovered quickly, but there is no denying that they are economically sensitive! In a recession you might expect a 20% decline in earnings in addition to a 20% to 40% decline in P/E multiples.

In contrast, PG is your classic defensive giant. Its earnings fell from $3.64 to $3.58, cash flow from $4.97 to $4.86. We did see P/E multiples contract, along with the rest of the market, but the denominator – earnings – was remarkably steady. Even while the global economy was going to hell in a handbasket, PG was selling product and turning a steady profit.

Once again, all three of these companies are what I would consider High Quality companies. They have strong credit ratings, diversified revenue streams, and the financial strength to make it through an economic downturn without damage to the business. All three companies survived and ultimately did very well. Heck, the Defensive company has been the WEAKEST of the three over the last fifteen years. (Not that anybody is complaining.)

In contrast, we have companies like SJM. SJM is clearly a Defensive company. Their sales ought to be relatively insensitive to macroeconomic conditions. People are not going to stop buying peanut butter and pet food in a recession. Their margins are impacted to a certain extent by currency translation and commodity costs, but have little to do with GDP growth.

Yet the quality of SJM does not compare to the quality of UTX, CSCO, or PG. The Big Heart acquisition stretched their finances, knocking them down from A3 credit (solid) to Baa2 credit (weak). Over the past 4.5 years they have struggled under this burden through a pattern of underinvestment (hurts revenue growth), divestments (hurts revenue growth), and debt reduction (hurts revenue growth). And their debt is STILL more than three times EBITDA.

At this time, SJM is hoping to stabilize revenue. Not grow. Not expand. Survive. They are definitely cheap on a P/E basis, and seem to have ample FCF to cover the dividend, but persistently shrinking revenues are a bad sign for any business, let alone one carrying a heavy debt load.

So you might do well buying and owning SJM. You get a bargain price on the business, and if they can eventually figure things out then the shares will eventually rebound. Moreover, it is very clearly a Defensive company. You don’t need to fear an impending recession, because that is unlikely to be material to their situation. But it is a no-moat company (even Morningstar agrees at this point) with borderline quality metrics. Management needs to execute or things could get really bad in a surprisingly short time. SJM is in better shape than KHC was, but not THAT much better shape.

So don’t confuse Defensive with Quality. A Defensive company need not fear a recession, but may still be at risk from mismanagement (and the incestuous management at SJM is a poor recipe for success). A Quality company has the strength to work through almost anything.

7 Me gusta

Texto sacado de un comentario acerca de MDT.

The advantage of quality is twofold.

  • First, it is less likely that I will be buying into a value trap. A quality stock purchased at a good valuation is a great recipe for strong returns.
  • Second, it allows me to put a greater sum into the position with minimal risk of loss.

"Quality scores" de su cartera de 40 valores

Keep in mind that this is simply a composite of Jefferson Research, Value Line, Moodys, and SSD numbers – especially the last two. It is a number I have found useful in my own approach, though it may not be appropriate to others. (The concept of “quality” is important to all systems, in my opinion, but is likely defined somewhat differently.)

19+ JNJ, AAPL, MSFT, PG, BRK.B, NSRGY, INTC
18 NKE, CSCO, MRK, HON, MDT, GOOG, HRL, DEO, ITW, PEP, KMB, HD, SYY, UTX, UL, MMM
17 UNH, UNP, GWW, NEE, DIS, AMGN, PFE
16 ETN, NVS, VFC, CVS, WEC, DUK, WTR
15 T, D
14 SO

Note that the last six are utilities (and T which is a semi-utility). Steady cash-flow businesses with very high capital requirements and (mostly) higher dividends. These companies tend to operate with higher debt levels and lower credit ratings, yet due to the stability of their revenues it isn’t clear that their operations are any riskier. You could reasonably argue that this metric treats them unfairly – or you could suggest that they might be riskier than people are recognizing?

CVS is my only position with a 2.5%+ portfolio rating and a Quality score of 16 or lower.

Please keep in mind that Valuation and Growth are represented elsewhere in the system. This number is not intended to reflect either one.

8 Me gusta

Acerca de las caídas de estas semanas:

"Let’s put this in perspective, people…

First, this isn’t merely a media scare. Politicians who dismiss it as such are sticking their heads in the sand. This has a lot in common with influenza (albeit a different family of virus), which kills hundreds of thousands of people each year. It might end up being less widespread, or might end up being deadlier, but it is clearly a big deal. That said, it isn’t the first deadly virus that the human race has encountered. There is no fundamental reason we can’t figure this one out given time. Time… That’s what all these quarantines and such are trying to buy us.

Second, the market is far from being cheap. The S&P500 remains 40% higher than it was in 2015, and while the global economy has progressed somewhat since then, there is no reason to believe it is undervalued here. Even after this decline, we are at similar levels to September 2018 and 10% above the levels of December 2018. Another 10% decline from here, across the board, and the market might be starting to look tempting. Another 30% or 40% decline from here and we would be seeing some REALLY good deals. I’ve covered my outstanding call trades, but have not otherwise bought anything yet. Plenty of cash available if those good deals come to pass.

Third, there is nothing YET that fundamentally threatens sound businesses. Earnings will be down over the first half of this year, perhaps longer, but we’ve hit recessions before and these Dividend Aristocrats have soldiered through. Expect they will do the same here as well.

Finally, the action this week appears to be irrational. I see no particular pattern in WHICH stocks are declining, which suggests to me that it is broad institutional deleveraging rather than actual concerns that are driving the market. So specific opportunities may arise even if the overall market is still fully valued."

2 Me gusta