Gracias. Me encanta leer todos tus planteamientos
3 Me gusta
Hoy os voy a poner las recomendaciones de compra para el mes de marzo. Mis criterios son los siguientes:
- Value Line Safety 3 o mejor
- Value Line Financial Streng B++ o mejor
- Low Projected Total Return 10% o más
- 18 month band price 10% o más
- Wide moat
- Si es narrow moat debe tener Stewardship Exemplary
| SecId | Ticker | Name | Sector | Industry | Currency | Last | Div Yield | Div frequency | Moat | MoatQ | MoatQ Score | Stewardship | Uncertainty | UncertaintyQ | UncertaintyQ Score | Distance to Default | Safety™ | Timeliness™ | Financial Strength Rating | Technical Rank | Earnings Predictability | Price Growth Persistence | Price Stability | FV | FVQ | M* P / FV | FT Target Price | Upside Potential | Proj Low TTL Return | Proj High TTL Return | Proj % Annual Total Return | 18 Month Pricing Band |
|---|---|---|---|---|---|---|---|---|---|---|---|---|---|---|---|---|---|---|---|---|---|---|---|---|---|---|---|---|---|---|---|---|
| 0P000000YD | XNAS:CHRW | C.H. Robinson Worldwide Inc | Industrials | Integrated Freight & Logistics | USD | 96.79 | 2.15% | Quarterly | Wide | Wide | 1.00 | Exemplary | Medium | Medium | 0.11 | 0.67 | 2 | 5 | A | 2 | 70 | 50 | 95 | 96.00 | 96.57 | 1.01 | 106.00 | 10% | 13% | 21% | 17% | 25% |
| 0P000000F0 | XNAS:AMGN | Amgen Inc | Health Care | Drug Manufacturers - General | USD | 227.03 | 3.18% | Quarterly | Wide | Wide | 1.00 | Exemplary | Medium | High | 0.18 | 0.69 | 1 | 4 | A++ | 3 | 100 | 75 | 100 | 260.00 | 229.28 | 0.93 | 250.00 | 10% | 12% | 18% | 15% | 10% |
| 0P000001R9 | XNYS:DPZ | Domino’s Pizza Inc | Consumer Discretionary | Restaurants | USD | 429.98 | 0.87% | Quarterly | Wide | Wide | 1.00 | Exemplary | Medium | High | 0.18 | 0.60 | 2 | 3 | A | 3 | 100 | 95 | 75 | 416.00 | 410.00 | 1.04 | 498.00 | 16% | 10% | 18% | 14% | 50% |
| 0P0000W3KZ | XNAS:FB | Meta Platforms Inc | Communication Services | Internet Content & Information | USD | 210.48 | — | — | Wide | Wide | 1.00 | Exemplary | High | Very High | 0.47 | 0.69 | 2 | 1 | A++ | 2 | 65 | 95 | 65 | 400.00 | 339.82 | 0.57 | 350.00 | 66% | 18% | 27% | 23% | 100% |
| 0P000001DB | XNAS:CMCSA | Comcast Corp | Communication Services | Entertainment | USD | 47.07 | 2.12% | Quarterly | Wide | Wide | 1.00 | Standard | Medium | High | 0.17 | 0.63 | 1 | 1 | A+ | 4 | 90 | 85 | 100 | 60.00 | 56.07 | 0.81 | 62.00 | 32% | 13% | 19% | 16% | 25% |
| 0P00012BBI | XNAS:GOOG | Alphabet Inc | Communication Services | Internet Content & Information | USD | 2690.39 | — | — | Wide | Wide | 1.00 | Exemplary | High | High | 0.30 | 0.80 | 1 | 1 | A++ | 2 | 75 | 100 | 95 | 3,600.00 | 3,080.74 | 0.81 | 3,560.00 | 32% | 12% | 18% | 15% | 35% |
| 0P000001BI | XNAS:CSGP | CoStar Group Inc | Industrials | Real Estate Services | USD | 61.7 | — | — | Wide | Wide | 1.00 | Exemplary | Very High | High | 0.17 | 0.76 | 2 | 3 | A+ | 2 | 65 | 95 | 75 | 73.00 | 74.60 | 0.84 | 84.00 | 36% | 11% | 20% | 16% | 70% |
| 0P0000020J | XNAS:ERIE | Erie Indemnity Co | Financials | Insurance Brokers | USD | 177.51 | 2.37% | Quarterly | — | Wide | 0.99 | — | — | High | 0.26 | 0.77 | 2 | 3 | A | 4 | 95 | 70 | 90 | — | 164.00 | 1.08 | 115.00 | -35% | 10% | 17% | 14% | 30% |
| 0P000000B7 | XNAS:AMZN | Amazon.com Inc | Consumer Discretionary | Internet Retail | USD | 3075.77 | — | — | Wide | Wide | 1.00 | Exemplary | High | High | 0.28 | 0.68 | 1 | 1 | A++ | 3 | 30 | 90 | 80 | 4,100.00 | 3,449.15 | 0.81 | 4,025.00 | 31% | 10% | 15% | 13% | 50% |
| 0P000000OE | XNAS:BIDU | Baidu Inc | Communication Services | Internet Content & Information | USD | 153.11 | — | — | Wide | Wide | 1.00 | Standard | High | High | 0.19 | 0.76 | 3 | – | A | – | 45 | 30 | 35 | 183.00 | 199.97 | 0.80 | 218.66 | 43% | 18% | 31% | 25% | 15% |
| 0P000003IL | XNYS:SPGI | S&P Global Inc | Financials | Financial Data & Stock Exchanges | USD | 380.89 | 0.81% | Quarterly | Wide | Wide | 1.00 | Exemplary | Medium | Medium | 0.14 | 0.79 | 2 | 1 | A | 2 | 100 | 95 | 95 | 425.00 | 392.13 | 0.93 | 491.50 | 29% | 10% | 16% | 13% | 40% |
| 0P000004EA | XNYS:PII | Polaris Inc | Consumer Discretionary | Recreational Vehicles | USD | 119.73 | 2.10% | Quarterly | Wide | Wide | 1.00 | Exemplary | High | Very High | 0.37 | 0.60 | 3 | 5 | A | 5 | 55 | 25 | 40 | 184.00 | 145.19 | 0.73 | 145.00 | 21% | 12% | 23% | 18% | 15% |
| 0P0000059E | XNAS:TROW | T. Rowe Price Group Inc | Financials | Asset Management | USD | 145.26 | 2.97% | Quarterly | Wide | Wide | 1.00 | Exemplary | Medium | High | 0.16 | 0.77 | 1 | 2 | A+ | 1 | 90 | 50 | 85 | 195.00 | 192.93 | 0.75 | 170.00 | 17% | 10% | 15% | 13% | 55% |
| 0P0000042B | XNAS:OMCL | Omnicell Inc | Health Care | Health Information Services | USD | 126.37 | — | — | — | Wide | 0.99 | — | — | High | 0.32 | 0.69 | 3 | 2 | B++ | 2 | 30 | 100 | 65 | — | 136.94 | 0.92 | 186.50 | 48% | 11% | 23% | 17% | 65% |
| 0P000003JU | XNYS:MDT | Medtronic PLC | Health Care | Medical Devices | USD | 105.84 | 2.33% | Quarterly | Wide | Wide | 1.00 | Standard | Medium | High | 0.18 | 0.72 | 1 | 3 | A++ | 3 | 75 | 80 | 95 | 129.00 | 119.57 | 0.85 | 124.00 | 17% | 10% | 15% | 13% | 35% |
| 0P00009FL7 | XNAS:MELI | MercadoLibre Inc | Consumer Discretionary | Internet Retail | USD | 1111.39 | — | Quarterly | Wide | Wide | 1.00 | Exemplary | High | High | 0.24 | 0.52 | 3 | 2 | B++ | 4 | 15 | 95 | 25 | 1,580.00 | 1,459.91 | 0.73 | 1,650.00 | 48% | 16% | 28% | 22% | 25% |
| 0P000005M8 | XNYS:UL | Unilever PLC | Consumer Staples | Household & Personal Products | USD | 50.55 | 3.96% | Quarterly | Wide | Wide | 1.00 | Standard | Low | High | 0.15 | 0.69 | 1 | 5 | A+ | 5 | 80 | 45 | 100 | 59.00 | 51.85 | 0.91 | 62.00 | 23% | 12% | 17% | 15% | 20% |
| 0P000003ZC | XNYS:NVS | Novartis AG | Health Care | Drug Manufacturers - General | USD | 87.63 | 3.65% | Annually | Wide | Wide | 1.00 | Standard | Low | Medium | 0.11 | 0.78 | 1 | 4 | A++ | 3 | 55 | 30 | 100 | 91.00 | 87.34 | 0.98 | 104.00 | 19% | 10% | 15% | 13% | 15% |
| 0P00000546 | XNAS:SBUX | Starbucks Corp | Consumer Discretionary | Restaurants | USD | 92.58 | 2.03% | Quarterly | Wide | Wide | 1.00 | Exemplary | Medium | High | 0.20 | 0.68 | 1 | 2 | A++ | 3 | 45 | 70 | 85 | 106.00 | 97.10 | 0.91 | 115.00 | 24% | 11% | 17% | 14% | 40% |
| 0P000005V9 | XNYS:WAT | Waters Corp | Health Care | Diagnostics & Research | USD | 323.65 | — | Annually | Wide | Wide | 1.00 | Exemplary | Medium | Medium | 0.15 | 0.72 | 2 | 4 | A | 3 | 95 | 90 | 85 | 250.00 | 272.55 | 1.24 | 350.00 | 8% | 14% | 25% | 20% | 20% |
| 0P000004FA | XNYS:LIN | Linde PLC | Materials | Specialty Chemicals | USD | 297.49 | 1.43% | Quarterly | Narrow | Wide | 0.99 | Standard | Medium | Medium | 0.11 | 0.73 | 2 | 3 | A | 1 | – | – | 95 | 325.00 | 297.87 | 0.96 | 375.00 | 26% | 10% | 18% | 14% | 15% |
| 0P000003KE | XNYS:MRK | Merck & Co Inc | Health Care | Drug Manufacturers - General | USD | 76.32 | 3.46% | Quarterly | Wide | Wide | 1.00 | Standard | Medium | High | 0.19 | 0.70 | 1 | 2 | A++ | 1 | 100 | 50 | 95 | 94.00 | 82.94 | 0.86 | 93.00 | 22% | 10% | 15% | 13% | 25% |
| 0P00018WBW | XNYS:YUMC | Yum China Holdings Inc | Consumer Discretionary | Restaurants | USD | 52.05 | 0.92% | Quarterly | Wide | Wide | 1.00 | Standard | Medium | High | 0.26 | 0.80 | 3 | 4 | B++ | 5 | 65 | 90 | 70 | 86.00 | 72.50 | 0.66 | 60.76 | 17% | 16% | 28% | 22% | 20% |
| 0P00000075 | XNYS:AMG | Affiliated Managers Group Inc | Financials | Asset Management | USD | 141.76 | 0.03% | Quarterly | Narrow | Narrow | 0.96 | Exemplary | High | High | 0.21 | 0.55 | 3 | 3 | B++ | 2 | 5 | 20 | 45 | 185.00 | 170.60 | 0.80 | 184.00 | 30% | 12% | 24% | 18% | 10% |
| 0P0000943F | XNYS:DFS | Discover Financial Services | Financials | Credit Services | USD | 124.01 | 1.56% | Quarterly | Narrow | Narrow | 0.84 | Exemplary | High | High | 0.35 | 0.88 | 3 | 4 | A | 3 | 40 | 75 | 35 | 135.00 | 141.73 | 0.90 | 144.00 | 16% | 13% | 24% | 19% | 25% |
| 0P000000UD | XNYS:SAM | Boston Beer Co Inc | Consumer Staples | Beverages - Brewers | USD | 380.53 | — | — | Narrow | Narrow | 0.98 | Exemplary | Medium | Very High | 0.52 | 0.58 | 3 | 3 | A+ | 3 | 60 | 55 | 45 | 750.00 | 771.73 | 0.50 | 475.00 | 25% | 10% | 22% | 16% | 50% |
| 0P000003PC | XNYS:MS | Morgan Stanley | Financials | Capital Markets | USD | 94.55 | 2.59% | Quarterly | Narrow | Narrow | 0.91 | Exemplary | High | High | 0.34 | 0.91 | 2 | 2 | B++ | 2 | 75 | 85 | 70 | 89.00 | 108.88 | 0.96 | 115.00 | 22% | 10% | 19% | 15% | 15% |
| 0P0001KOSE | XNYS:PLTR | Palantir Technologies Inc | Information Technology | Software - Infrastructure | USD | 11.47 | — | — | Narrow | Narrow | 0.96 | Exemplary | High | Very High | 0.61 | 0.63 | 3 | – | B++ | – | – | – | – | 31.00 | 23.17 | 0.42 | 15.00 | 31% | 23% | 36% | 30% | 205% |
Todos los meses pondré el resultado de lo que dé. Respecto a la lista ECSS del otro hilo, la doy por muerta. lleva mucha faena actualizarla y no le veo mucha utilidad, estando la CQSS, el índice Cazadividendos y las recomendaciones que se hacen en este foro. Con estas recomendaciones mensuales espero descubriros algunas oportunidades de inversión.
20 Me gusta
Acaba el mes de febrero y le echamos un vistazo a la cuenta de Indexa de mi hijo. El objetivo para 2039 es de 211.127,62 EUR . Actualmente llevamos acumulado 6.113,08 EUR y la rentabilidad actual es del 11,2%. Seguimos de bajada y la rentabilidad es todavía algo superior a la esperada. En fin, aún nos quedan 204 meses por delante y unos 205.000 euros para conseguir el objetivo. La aportación mensual debería ser de 305,52 EUR .
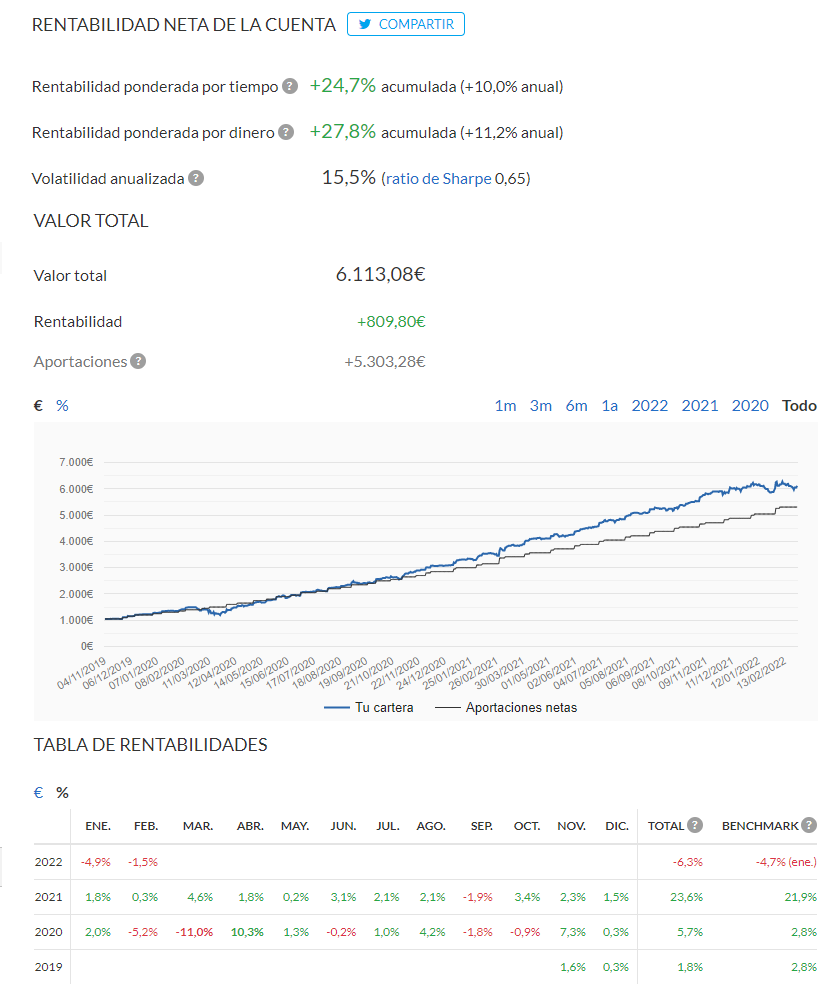
De momento quieto. Tendría ahora en mente Boston Beer, T. Row Price, Amazon, Google, Comcast y Merck. Con mucha liquidez ahora, que suba el euribor no supone ningún problema ni me planteo amortizar hipoteca. Ahora, si los tipos se ponen realmente altos empezaré a amortizar hasta que la cuota no se convierta en un problema. Ahora mismo tengo un 40% en liquidez. Sin miedo a la inflación. Es preferible no cometer errores. También pensando en pedir un préstamo para afrontar una inversión inmobiliaria fuera de España.
Nosotros a lo nuestro.
13 Me gusta
Termina Marzo y comienza la primavera y como de costumbre le echamos un vistazo a la cuenta de Indexa de mi hijo. El objetivo para 2039 es de 212.498,31 EUR (como sube la inflación!). Actualmente llevamos acumulado 6.711,21 EUR y la rentabilidad actual es del 13,6%. ¿Caerán algún día las bolsas de verdad de la buena?. En fin, aún nos quedan 203 meses por delante y unos 205.800 euros para conseguir el objetivo (vamos para atrás!! nos falta más que al principio!!). La aportación mensual debería ser de 213,53 EUR .
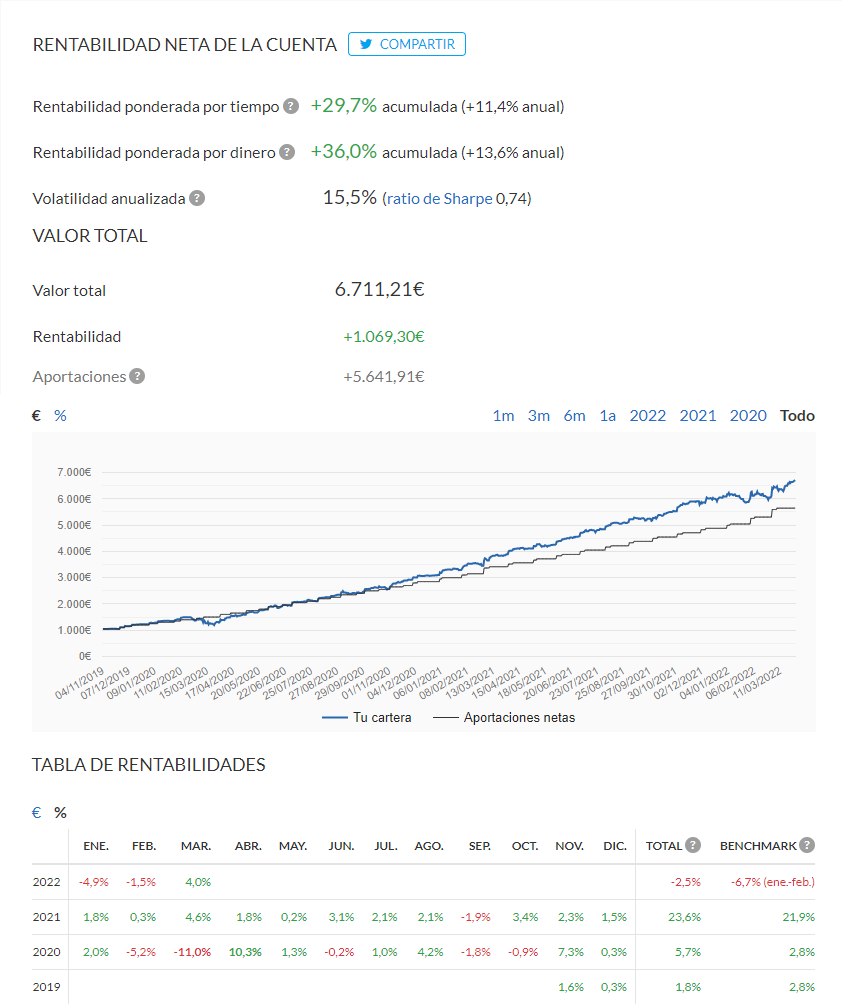
A ver como se comporta el Euribor, la inflación y todo lo demás también que diría Calamaro. De momento quieto. Si veo alguna buena oportunidad quizá compre algo.
8 Me gusta
La lista de la compra y una canción como un cupón de los ciegos para el mes de Abril:
| SecId | Ticker | Name | Sector | Industry | Currency | Last | Div Yield | Div frequency | M* Moat | M* Moat Trend | M* MoatQ | M* MoatQ Score | M* Stewardship | M* Uncertainty | M* UncertaintyQ | M* UncertaintyQ Score | M* distance to Default | Safety™ | Timeliness™ | Financial Strength Rating | Technical Rank | Earnings Predictability | Price Growth Persistence | Price Stability | FV | FVQ | M* P / FV | FT Target Price | Upside Potential | Proj Low TTL Return | Proj High TTL Return | Proj % Annual Total Return | 18 Month Pricing Band |
|---|---|---|---|---|---|---|---|---|---|---|---|---|---|---|---|---|---|---|---|---|---|---|---|---|---|---|---|---|---|---|---|---|---|
| 0P00009QS2 | XETR:SIE | Siemens AG | Industrials | Specialty Industrial Machinery | EUR | 126.70 | 3.16% | Annually | Narrow | Stable | Narrow | 0.986 | Exemplary | Medium | Medium | 0.113 | 0.568 | 2 | 3 | A | 3 | 75 | 25 | 80 | 145.00 | 140.96 | 0.886 | 178.00 | 40% | 16.0% | 25% | 21% | 20% |
| 0P000000FH | XNAS:ADI | Analog Devices Inc | Information Technology | Semiconductors | USD | 165.36 | 1.71% | Quarterly | Wide | Stable | Wide | 0.998 | Exemplary | Medium | Medium | 0.139 | 0.681 | 1 | 2 | A+ | 3 | 75 | 85 | 90 | 172.00 | 173.70 | 0.957 | 209.00 | 26% | 10.0% | 15% | 13% | 25% |
| 0P000000B7 | XNAS:AMZN | Amazon.com Inc | Consumer Discretionary | Internet Retail | USD | 3,271.20 | — | — | Wide | Stable | Wide | 1.000 | Exemplary | High | High | 0.235 | 0.671 | 1 | 1 | A++ | 5 | 30 | 90 | 80 | 4,100.00 | 3,405.76 | 0.872 | 4,000.00 | 22% | 10.0% | 15% | 13% | 20% |
| 0P000000YD | XNAS:CHRW | C.H. Robinson Worldwide Inc | Industrials | Integrated Freight & Logistics | USD | 103.13 | 2.06% | Quarterly | Wide | Negative | Wide | 0.997 | Exemplary | Medium | Medium | 0.137 | 0.649 | 2 | 5 | A | 3 | 70 | 50 | 95 | 96.00 | 100.36 | 1.050 | 106.00 | 3% | 13.0% | 21% | 17% | 10% |
| 0P000001DB | XNAS:CMCSA | Comcast Corp | Communication Services | Entertainment | USD | 47.70 | 2.10% | Quarterly | Wide | Stable | Wide | 0.997 | Standard | Medium | High | 0.159 | 0.636 | 1 | 2 | A+ | 4 | 90 | 85 | 100 | 60.00 | 55.63 | 0.825 | 60.00 | 26% | 18.0% | 22% | 20% | 25% |
| 0P000001BI | XNAS:CSGP | CoStar Group Inc | Industrials | Real Estate Services | USD | 66.00 | — | — | Wide | Stable | Wide | 0.996 | Exemplary | Very High | High | 0.175 | 0.743 | 2 | 3 | A+ | 3 | 65 | 95 | 75 | 73.00 | 77.54 | 0.877 | 75.50 | 14% | 11.0% | 20% | 16% | 25% |
| 0P0000020J | XNAS:ERIE | Erie Indemnity Co | Financials | Insurance Brokers | USD | 181.36 | 2.32% | Quarterly | — | — | Wide | 0.995 | — | — | High | 0.233 | 0.768 | 2 | 4 | A | 4 | 95 | 70 | 90 | — | 168.23 | 1.078 | 115.00 | -37% | 10.0% | 17% | 14% | 30% |
| 0P0000W3KZ | XNAS:FB | Meta Platforms Inc | Communication Services | Internet Content & Information | USD | 224.85 | — | — | Wide | Stable | Wide | 0.998 | Exemplary | High | Very High | 0.412 | 0.671 | 2 | 1 | A++ | 4 | 65 | 95 | 65 | 400.00 | 362.42 | 0.590 | 338.00 | 50% | 18.0% | 27% | 23% | 15% |
| 0P000002FD | XNAS:GILD | Gilead Sciences Inc | Health Care | Drug Manufacturers - General | USD | 59.67 | 4.79% | Quarterly | Wide | Stable | Wide | 0.999 | Standard | Medium | High | 0.204 | 0.690 | 1 | 2 | A | 4 | 25 | 30 | 100 | 81.00 | 67.21 | 0.805 | 70.00 | 17% | 11.0% | 17% | 14% | 25% |
| 0P00012BBI | XNAS:GOOG | Alphabet Inc | Communication Services | Internet Content & Information | USD | 2,814.00 | — | — | Wide | Stable | Wide | 0.999 | Exemplary | High | High | 0.234 | 0.791 | 1 | 1 | A++ | 3 | 75 | 100 | 95 | 3,600.00 | 3,065.03 | 0.844 | 3,380.00 | 20% | 12.0% | 18% | 15% | 30% |
| 0P0000042B | XNAS:OMCL | Omnicell Inc | Health Care | Health Information Services | USD | 129.11 | — | — | — | — | Wide | 0.991 | — | — | High | 0.267 | 0.705 | 3 | 3 | B++ | 3 | 30 | 100 | 65 | — | 125.02 | 1.033 | 183.00 | 42% | 11.0% | 23% | 17% | 30% |
| 0P000004J4 | XNAS:QCOM | Qualcomm Inc | Information Technology | Semiconductors | USD | 146.99 | 1.85% | Quarterly | Narrow | Negative | Wide | 0.995 | Standard | High | Medium | 0.137 | 0.622 | 3 | 1 | A+ | 2 | 60 | 40 | 50 | 163.00 | 155.84 | 0.922 | 210.00 | 43% | 14.0% | 25% | 20% | 55% |
| 0P00000546 | XNAS:SBUX | Starbucks Corp | Consumer Discretionary | Restaurants | USD | 91.49 | 2.05% | Quarterly | Wide | Stable | Wide | 1.000 | Exemplary | Medium | High | 0.161 | 0.649 | 1 | 2 | A++ | 3 | 45 | 70 | 85 | 106.00 | 101.64 | 0.881 | 115.00 | 26% | 11.0% | 17% | 14% | 15% |
| 0P000004ZF | XNAS:SWKS | Skyworks Solutions Inc | Information Technology | Semiconductors | USD | 132.03 | 1.65% | Quarterly | Narrow | Stable | Narrow | 0.981 | Exemplary | High | High | 0.217 | 0.649 | 3 | 3 | A | 4 | 70 | 65 | 55 | 210.00 | 185.17 | 0.668 | 175.00 | 33% | 18.0% | 30% | 24% | 45% |
| 0P0000059E | XNAS:TROW | T. Rowe Price Group Inc | Financials | Asset Management | USD | 152.86 | 2.90% | Quarterly | Wide | Stable | Wide | 0.997 | Exemplary | Medium | High | 0.179 | 0.760 | 1 | 3 | A+ | 4 | 90 | 50 | 85 | 195.00 | 199.77 | 0.774 | 159.00 | 4% | 10.0% | 15% | 13% | 20% |
| 0P00000016 | XNYS:ABB | ABB Ltd | Industrials | Electrical Equipment & Parts | USD | 32.87 | 2.70% | Annually | Wide | Stable | Wide | 0.998 | Standard | Medium | Medium | 0.121 | 0.729 | 2 | 2 | B++ | 2 | 65 | 30 | 90 | 38.00 | 34.39 | 0.908 | 40.00 | 22% | 10.0% | 18% | 14% | 15% |
| 0P00000075 | XNYS:AMG | Affiliated Managers Group Inc | Financials | Asset Management | USD | 144.47 | 0.03% | Quarterly | Narrow | Negative | Narrow | 0.946 | Exemplary | High | High | 0.177 | 0.530 | 3 | 3 | B++ | 2 | 5 | 20 | 45 | 185.00 | 186.67 | 0.777 | 186.50 | 29% | 12.0% | 24% | 18% | 15% |
| 0P0000943F | XNYS:DFS | Discover Financial Services | Financials | Credit Services | USD | 110.12 | 1.76% | Quarterly | Narrow | Stable | None | 0.634 | Exemplary | High | Very High | 0.354 | 0.870 | 3 | 4 | A | 2 | 40 | 75 | 35 | 138.00 | 121.90 | 0.847 | 144.00 | 31% | 13.0% | 24% | 19% | 40% |
| 0P000001R9 | XNYS:DPZ | Domino’s Pizza Inc | Consumer Discretionary | Restaurants | USD | 397.18 | 0.99% | Quarterly | Wide | Stable | Wide | 0.997 | Exemplary | Medium | High | 0.166 | 0.578 | 2 | 3 | A | 2 | 100 | 95 | 75 | 416.00 | 388.25 | 0.988 | 475.00 | 20% | 10.0% | 18% | 14% | 35% |
| 0P00000357 | XNYS:KMB | Kimberly-Clark Corp | Consumer Staples | Household & Personal Products | USD | 125.03 | 3.66% | Quarterly | Narrow | Stable | Wide | 0.994 | Exemplary | Medium | Medium | 0.106 | 0.701 | 1 | 4 | A | 3 | 60 | 45 | 100 | 125.00 | 120.94 | 1.017 | 128.00 | 2% | 10.0% | 16% | 13% | 15% |
| 0P000003JU | XNYS:MDT | Medtronic PLC | Health Care | Medical Devices | USD | 112.52 | 2.24% | Quarterly | Wide | Stable | Wide | 0.999 | Standard | Medium | High | 0.182 | 0.712 | 1 | 3 | A++ | 5 | 75 | 80 | 95 | 129.00 | 117.91 | 0.911 | 124.00 | 10% | 10.0% | 15% | 13% | 25% |
| 0P0000000I | XNYS:MMM | 3M Co | Industrials | Conglomerates | USD | 149.69 | 3.96% | Quarterly | Wide | Stable | Wide | 1.000 | Standard | Medium | High | 0.202 | 0.701 | 1 | 4 | A++ | 4 | 95 | 50 | 95 | 192.00 | 171.01 | 0.825 | 173.00 | 16% | 14.0% | 19% | 17% | 25% |
| 0P000003KE | XNYS:MRK | Merck & Co Inc | Health Care | Drug Manufacturers - General | USD | 83.52 | 3.21% | Quarterly | Wide | Stable | Wide | 0.999 | Standard | Medium | High | 0.151 | 0.687 | 1 | 2 | A++ | 5 | 100 | 50 | 95 | 94.00 | 85.95 | 0.928 | 93.00 | 11% | 13.0% | 18% | 16% | 10% |
| 0P000003ZC | XNYS:NVS | Novartis AG | Health Care | Drug Manufacturers - General | USD | 87.69 | 3.79% | Annually | Wide | Stable | Wide | 0.998 | Standard | Low | Medium | 0.117 | 0.774 | 1 | 4 | A++ | 4 | 55 | 30 | 100 | 91.00 | 87.52 | 0.982 | 104.00 | 19% | 11.0% | 16% | 14% | 15% |
| 0P000004EA | XNYS:PII | Polaris Inc | Consumer Discretionary | Recreational Vehicles | USD | 106.44 | 2.38% | Quarterly | Wide | Stable | Wide | 0.996 | Exemplary | High | Very High | 0.505 | 0.576 | 3 | 5 | A | 3 | 55 | 25 | 40 | 184.00 | 135.11 | 0.667 | 145.00 | 36% | 12.0% | 23% | 18% | 30% |
| 0P000000UD | XNYS:SAM | Boston Beer Co Inc | Consumer Staples | Beverages - Brewers | USD | 391.15 | — | — | Narrow | Stable | Narrow | 0.976 | Exemplary | Medium | Very High | 0.520 | 0.586 | 3 | 4 | A+ | 4 | 60 | 55 | 45 | 750.00 | 702.35 | 0.539 | 475.00 | 21% | 10.0% | 22% | 16% | 25% |
| 0P000003IL | XNYS:SPGI | S&P Global Inc | Financials | Financial Data & Stock Exchanges | USD | 407.88 | 0.76% | Quarterly | Wide | Stable | Wide | 1.000 | Exemplary | Medium | Medium | 0.135 | 0.776 | 2 | 1 | A | 3 | 100 | 95 | 95 | 430.00 | 392.78 | 0.991 | 485.00 | 19% | 10.0% | 16% | 13% | 30% |
| 0P000005AR | XNYS:TSM | Taiwan Semiconductor Manufacturing Co Ltd | Information Technology | Semiconductors | USD | 102.79 | 1.88% | Quarterly | Wide | Stable | Wide | 0.999 | Exemplary | Medium | Very High | 0.447 | 0.799 | 1 | 3 | A++ | 1 | 80 | 95 | 80 | 179.00 | 129.79 | 0.666 | 157.90 | 54% | 10.0% | 18% | 14% | 60% |
| 0P000005M8 | XNYS:UL | Unilever PLC | Consumer Staples | Household & Personal Products | USD | 46.60 | 4.30% | Quarterly | Wide | Stable | Wide | 1.000 | Standard | Low | High | 0.175 | 0.665 | 1 | 5 | A+ | 3 | 80 | 45 | 100 | 56.00 | 50.50 | 0.875 | 62.00 | 33% | 12.0% | 17% | 15% | 30% |
| 0P000005V9 | XNYS:WAT | Waters Corp | Health Care | Diagnostics & Research | USD | 308.58 | — | Annually | Wide | Stable | Wide | 0.999 | Exemplary | Medium | Medium | 0.118 | 0.715 | 2 | 4 | A | 3 | 95 | 90 | 85 | 250.00 | 260.95 | 1.208 | 350.00 | 13% | 14.0% | 25% | 20% | 20% |
8 Me gusta
Termina Abril y ya vienen los turistas y la playa y como de costumbre le echamos un vistazo a la cuenta de Indexa de mi hijo. El objetivo para 2039 es de 218.569,10 EUR (¡como sube la inflación!). Actualmente llevamos acumulado 6.742,80 EUR y la rentabilidad actual es del 10,7%. Aunque ha sido un mes regulero seguimos teniendo rentabilidad de dos dígitos. En fin, aún nos quedan 202 meses por delante y unos 212.000 euros para conseguir el objetivo (cada vez más lejos). La aportación mensual debería ser de 337,09 EUR.

Me quedan 6 meses de euribor negativo en el -0,237%. Asumo que acabaremos el año entorno al 1%. La próxima revisión aplicará en diciembre con la media de octubre; ya veremos que hacemos. Este mes he cobrado el bonus y estoy pensando en entrar en Starbucks. Por otro lado, la cartera se está comportando fenomenal. La más rezagada es Verizon, el resto en verde, incluyendo Gilead y Unilever que vuelven a estar por arriba de lo que las compre, además la fortaleza del dólar ayuda también.
13 Me gusta
@Marcos_Torcal_Garcia para tu hijo inviertes en indexados, pero para ti?
Sigues una estrategia DGI? En que criterios te fijas para comprar o no una accion?
Saludos
Invierto en acciones individuales y también en Indexa. Los criterios seleccionar acciones son solidez financiera, ventajas competitivas duraderas (moat), rentabilidad por dividendo por encima de la media, y un total return esperado de al menos un 10% (en el peor de los casos).
5 Me gusta
Cuando hablas de RPD superior a la media, te refieres que sea superior a la media de los últimos 5 años como creo que recomendaba G.Weiss?. El Total return esperado del 10% lo miras con el número de chowder?
Saludos y gracias
La RPD del sp500 es del 1,5% aprox. Lo que hago es multiplicar este número por 1,5, y me da 2,25%. Me centro en acciones que tengan una RPD mayor que esa aunque no es una regla irrompible.
El total return lo calculo tal como lo hace Josh Peters en su libro The Utimate Dividend Playbook. También me fijo en las estimaciones del Value Line.
5 Me gusta
Muchas gracias Marcos, me leeré ese libro ![]()
La lista de la compra de este mes:
| SecId | Ticker | Name | Sector | Industry | Currency | Last | Div Yield | Div frequency | M* Moat | M* Moat Trend | M* MoatQ | M* MoatQ Score | M* Stewardship | M* Uncertainty | M* UncertaintyQ | M* UncertaintyQ Score | M* distance to Default | Safety™ | Timeliness™ | Financial Strength Rating | Technical Rank | Earnings Predictability | Price Growth Persistence | Price Stability | FV | FVQ | M* P / FV | FT Target Price | Upside Potential | Proj Low TTL Return | Proj High TTL Return | Proj % Annual Total Return | 18 Month Pricing Band |
|---|---|---|---|---|---|---|---|---|---|---|---|---|---|---|---|---|---|---|---|---|---|---|---|---|---|---|---|---|---|---|---|---|---|
| 0P0000000I | XNYS:MMM | 3M Co | Industrials | Conglomerates | USD | 144.22 | 4.11% | Quarterly | Wide | Wide | 0.9997 | Standard | Medium | High | 0.1549 | 0.6959 | 1 | 4 | A++ | 4 | 95 | 45 | 95 | 186.00 | 165.04 | 0.822 | 161 | 11.6% | 14% | 19% | 17% | 30.0% | |
| 0P00000016 | XNYS:ABB | ABB Ltd | Industrials | Electrical Equipment & Parts | USD | 29.87 | 2.97% | Annually | Wide | Wide | 0.9986 | Standard | Medium | Medium | 0.1339 | 0.6953 | 2 | 2 | B++ | 1 | 65 | 30 | 90 | 38.00 | 32.10 | 0.852 | 39.33 | 31.7% | 10% | 18% | 14% | 30.0% | |
| 0P0000004C | XNYS:ACN | Accenture PLC | Information Technology | Information Technology Services | USD | 300.36 | 1.26% | Quarterly | Wide | Wide | 0.9994 | Exemplary | Medium | Medium | 0.1370 | 0.7580 | 1 | 3 | A++ | 3 | 100 | 95 | 100 | 258.00 | 281.69 | 1.113 | 390 | 29.8% | 10% | 15% | 13% | 30.0% | |
| 0P0000005M | XNAS:ADBE | Adobe Inc | Information Technology | Software - Infrastructure | USD | 395.95 | — | Quarterly | Wide | Wide | 0.9999 | Exemplary | Medium | High | 0.2843 | 0.6679 | 1 | 1 | A+ | 4 | 70 | 95 | 80 | 615.00 | 519.46 | 0.698 | 570 | 44.0% | 15% | 21% | 18% | 65.0% | |
| 0P0000005S | XNYS:AAP | Advance Auto Parts Inc | Consumer Discretionary | Specialty Retail | USD | 199.63 | 2.25% | Quarterly | Narrow | Narrow | 0.9753 | Exemplary | Medium | Medium | 0.1375 | 0.6315 | 3 | 3 | A | 3 | 75 | 50 | 50 | 233.00 | 209.34 | 0.903 | 266 | 33.2% | 10% | 21% | 16% | 30.0% | |
| 0P00000075 | XNYS:AMG | Affiliated Managers Group Inc | Financials | Asset Management | USD | 125.57 | 0.03% | Quarterly | Narrow | Narrow | 0.9703 | Exemplary | High | High | 0.1753 | 0.5105 | 3 | 3 | B++ | 3 | 10 | 15 | 45 | 185.00 | 174.86 | 0.698 | 172.5 | 37.4% | 17% | 30% | 24% | 35.0% | |
| 0P0000007L | XNYS:APD | Air Products & Chemicals Inc | Materials | Specialty Chemicals | USD | 234.07 | 2.61% | Quarterly | Narrow | Wide | 0.9928 | Exemplary | Medium | High | 0.2537 | 0.7215 | 1 | 3 | A++ | 5 | 100 | 70 | 95 | 317.00 | 269.23 | 0.799 | 300 | 28.2% | 11% | 16% | 14% | 25.0% | |
| 0P00012BBI | XNAS:GOOG | Alphabet Inc | Communication Services | Internet Content & Information | USD | 2,299.33 | — | — | Wide | Wide | 0.9993 | Exemplary | High | Very High | 0.4673 | 0.7783 | 1 | 1 | A++ | 2 | 75 | 100 | 95 | 3,600.00 | 3,006.12 | 0.696 | 3150 | 37.0% | 17% | 23% | 20% | 60.0% | |
| 0P000000B7 | XNAS:AMZN | Amazon.com Inc | Consumer Discretionary | Internet Retail | USD | 2,485.63 | — | — | Wide | Wide | 0.9993 | Exemplary | High | High | 0.3063 | 0.6313 | 1 | 1 | A++ | 4 | 30 | 90 | 75 | 3,850.00 | 3,225.33 | 0.703 | 3760 | 51.3% | 16% | 22% | 19% | 55.0% | |
| 0P000000F0 | XNAS:AMGN | Amgen Inc | Health Care | Drug Manufacturers - General | USD | 233.19 | 3.10% | Quarterly | Wide | Wide | 0.9995 | Exemplary | Medium | High | 0.1527 | 0.6745 | 1 | 4 | A++ | 4 | 100 | 75 | 100 | 260.00 | 234.84 | 0.942 | 250 | 7.2% | 12% | 18% | 15% | 10.0% | |
| 0P000000FH | XNAS:ADI | Analog Devices Inc | Information Technology | Semiconductors | USD | 154.38 | 1.83% | Quarterly | Wide | Wide | 0.9979 | Exemplary | Medium | Medium | 0.1457 | 0.6668 | 1 | 2 | A+ | 3 | 80 | 85 | 85 | 172.00 | 171.96 | 0.898 | 208 | 34.7% | 10% | 15% | 13% | 35.0% | |
| 0P000000PH | XNYS:BK | Bank of New York Mellon Corp | Financials | Asset Management | USD | 42.06 | 3.23% | Quarterly | Wide | None | 0.1919 | Standard | Medium | High | 0.2746 | 0.8997 | 2 | 2 | A | 1 | 90 | 50 | 80 | 55.00 | 58.38 | 0.742 | 54 | 28.4% | 15% | 23% | 19% | 10.0% | |
| 0P000000UD | XNYS:SAM | Boston Beer Co Inc | Consumer Staples | Beverages - Brewers | USD | 375.00 | — | — | Narrow | Narrow | 0.9725 | Exemplary | Medium | Very High | 0.4708 | 0.5813 | 3 | 4 | A+ | 3 | 25 | 55 | 40 | 740.00 | 748.79 | 0.504 | 388.5 | 3.6% | 14% | 26% | 20% | 30.0% | |
| 0P000000YD | XNAS:CHRW | C.H. Robinson Worldwide Inc | Industrials | Integrated Freight & Logistics | USD | 106.15 | 2.00% | Quarterly | Wide | Wide | 0.9969 | Exemplary | Medium | Medium | 0.1352 | 0.6352 | 2 | 5 | A | 3 | 65 | 45 | 90 | 96.00 | 104.33 | 1.060 | 115 | 8.3% | 13% | 21% | 17% | 10.0% | |
| 0P000001DB | XNAS:CMCSA | Comcast Corp | Communication Services | Entertainment | USD | 39.76 | 2.57% | Quarterly | Wide | Wide | 0.9966 | Standard | Medium | High | 0.1805 | 0.6148 | 1 | 2 | A+ | 4 | 90 | 85 | 100 | 60.00 | 56.87 | 0.680 | 60 | 50.9% | 18% | 22% | 20% | 40.0% | |
| 0P000001BI | XNAS:CSGP | CoStar Group Inc | Industrials | Real Estate Services | USD | 63.62 | — | — | Wide | Wide | 0.9964 | Exemplary | Very High | High | 0.1704 | 0.7354 | 2 | 3 | A+ | 3 | 70 | 95 | 70 | 73.00 | 78.26 | 0.841 | 76 | 19.5% | 11% | 20% | 16% | 30.0% | |
| 0P0000943F | XNYS:DFS | Discover Financial Services | Financials | Credit Services | USD | 112.46 | 1.73% | Quarterly | Narrow | None | 0.6850 | Exemplary | High | High | 0.3216 | 0.8649 | 3 | 4 | A | 3 | 40 | 75 | 35 | 138.00 | 133.38 | 0.829 | 142 | 26.3% | 14% | 25% | 20% | 30.0% | |
| 0P000001R9 | XNYS:DPZ | Domino’s Pizza Inc | Consumer Discretionary | Restaurants | USD | 338.00 | 1.16% | Quarterly | Wide | Wide | 0.9972 | Exemplary | Medium | High | 0.2242 | 0.5564 | 2 | 3 | A | 3 | 95 | 95 | 75 | 416.00 | 389.93 | 0.839 | 427.5 | 26.5% | 10% | 18% | 14% | 60.0% | |
| 0P0000020J | XNAS:ERIE | Erie Indemnity Co | Financials | Insurance Brokers | USD | 160.28 | 2.68% | Quarterly | — | Wide | 0.9936 | — | — | High | 0.2793 | 0.7590 | 2 | 4 | A | 4 | 95 | 65 | 90 | — | 160.95 | 0.996 | 115 | -28.3% | 10% | 17% | 14% | 45.0% | |
| 0P00000232 | XNYS:FICO | Fair Isaac Corp | Information Technology | Software - Application | USD | 373.51 | — | Quarterly | — | Wide | 0.9916 | — | — | High | 0.2889 | 0.5737 | 3 | 2 | B++ | 1 | 95 | 90 | 60 | — | 379.89 | 0.983 | 538 | 44.0% | 10% | 22% | 16% | 50.0% | |
| 0P000002AB | XNYS:BEN | Franklin Resources Inc | Financials | Asset Management | USD | 24.59 | 4.64% | Quarterly | Narrow | Narrow | 0.8872 | Exemplary | High | Medium | 0.1372 | 0.5553 | 3 | 3 | B++ | 3 | 55 | 5 | 60 | 33.00 | 34.71 | 0.726 | 28 | 13.9% | 21% | 30% | 26% | 50.0% | |
| 0P000002FD | XNAS:GILD | Gilead Sciences Inc | Health Care | Drug Manufacturers - General | USD | 59.34 | 4.82% | Quarterly | Wide | Wide | 0.9989 | Standard | Medium | High | 0.1717 | 0.6859 | 1 | 2 | A | 5 | 25 | 30 | 100 | 81.00 | 68.34 | 0.795 | 69 | 16.3% | 11% | 17% | 14% | 25.0% | |
| 0P000002X8 | XNAS:INTC | Intel Corp | Information Technology | Semiconductors | USD | 43.59 | 3.23% | Quarterly | Wide | Wide | 0.9960 | Standard | High | High | 0.2893 | 0.6647 | 1 | 2 | A++ | 4 | 95 | 70 | 70 | 65.00 | 56.95 | 0.715 | 50.5 | 15.9% | 25% | 30% | 28% | 10.0% | |
| 0P000004FA | XNYS:LIN | Linde PLC | Materials | Specialty Chemicals | USD | 311.96 | 1.39% | Quarterly | Narrow | Wide | 0.9921 | Standard | Medium | Medium | 0.1395 | 0.6996 | 2 | 3 | A | 3 | – | – | 90 | 333.00 | 320.91 | 0.954 | 370 | 18.6% | 10% | 18% | 14% | 10.0% | |
| 0P000003JU | XNYS:MDT | Medtronic PLC | Health Care | Medical Devices | USD | 104.36 | 2.41% | Quarterly | Wide | Wide | 0.9986 | Standard | Medium | High | 0.1572 | 0.7046 | 1 | 3 | A++ | 4 | 75 | 80 | 95 | 129.00 | 117.60 | 0.846 | 124 | 18.8% | 10% | 15% | 13% | 35.0% | |
| 0P0000W3KZ | XNAS:FB | Meta Platforms Inc | Communication Services | Internet Content & Information | USD | 200.47 | — | — | Wide | Wide | 0.9989 | Exemplary | High | Very High | 0.3808 | 0.6325 | 3 | 1 | A+ | 4 | 65 | 95 | 50 | 384.00 | 343.47 | 0.551 | 300 | 49.6% | 31% | 42% | 37% | 30.0% | |
| 0P000002L4 | XNAS:MNST | Monster Beverage Corp | Consumer Staples | Beverages - Non-Alcoholic | USD | 85.68 | — | — | Narrow | Wide | 0.9947 | Standard | Medium | Medium | 0.1174 | 0.7592 | 1 | 2 | A+ | 5 | 100 | 75 | 90 | 82.00 | 80.01 | 1.058 | 100 | 16.7% | 10% | 16% | 13% | 25.0% | |
| 0P000003ZC | XNYS:NVS | Novartis AG | Health Care | Drug Manufacturers - General | USD | 88.03 | 3.78% | Annually | Wide | Wide | 0.9988 | Standard | Low | Medium | 0.1032 | 0.7508 | 1 | 4 | A++ | 4 | 55 | 30 | 100 | 91.00 | 86.22 | 0.993 | 105 | 19.3% | 11% | 16% | 14% | 15.0% | |
| 0P0000042B | XNAS:OMCL | Omnicell Inc | Health Care | Health Information Services | USD | 109.17 | — | — | — | Wide | 0.9905 | — | — | High | 0.2795 | 0.6950 | 3 | 3 | B++ | 1 | 30 | 100 | 65 | — | 125.39 | 0.871 | 181 | 65.8% | 11% | 23% | 17% | 55.0% | |
| 0P0000043L | XNYS:ORCL | Oracle Corp | Information Technology | Software - Infrastructure | USD | 73.40 | 1.74% | Quarterly | Narrow | Wide | 0.9942 | Poor | Medium | High | 0.2567 | 0.5955 | 1 | 3 | A++ | 2 | 100 | 85 | 95 | 63.00 | 76.44 | 1.053 | 89 | 21.3% | 11% | 16% | 14% | 20.0% | |
| 0P0001KOSE | XNYS:PLTR | Palantir Technologies Inc | Information Technology | Software - Infrastructure | USD | 10.40 | — | — | Narrow | Narrow | 0.9623 | Exemplary | High | Extreme | 1.0514 | 0.6189 | 3 | – | B++ | – | – | – | – | 31.00 | 22.51 | 0.389 | 15.5 | 49.0% | 26% | 39% | 33% | 135.0% | |
| 0P00016CGN | XNAS:PYPL | PayPal Holdings Inc | Information Technology | Credit Services | USD | 87.93 | — | — | Narrow | Wide | 0.9905 | Standard | High | High | 0.2317 | 0.5812 | 3 | 1 | A | 3 | 65 | 90 | 45 | 139.00 | 140.72 | 0.629 | 118 | 34.2% | 18% | 30% | 24% | 40.0% | |
| 0P000004EA | XNYS:PII | Polaris Inc | Consumer Discretionary | Recreational Vehicles | USD | 94.94 | 2.66% | Quarterly | Wide | Wide | 0.9960 | Exemplary | High | Very High | 0.5776 | 0.5462 | 3 | 5 | A | 4 | 55 | 15 | 40 | 184.00 | 137.72 | 0.590 | 133 | 40.1% | 13% | 25% | 19% | 45.0% | |
| 0P000004J4 | XNAS:QCOM | Qualcomm Inc | Information Technology | Semiconductors | USD | 139.69 | 1.95% | Quarterly | Narrow | Wide | 0.9952 | Standard | High | High | 0.2174 | 0.5963 | 3 | 2 | A+ | 2 | 60 | 35 | 50 | 163.00 | 162.56 | 0.858 | 200 | 43.2% | 14% | 25% | 20% | 40.0% | |
| 0P000003IL | XNYS:SPGI | S&P Global Inc | Financials | Financial Data & Stock Exchanges | USD | 376.50 | 0.82% | Quarterly | Wide | Wide | 0.9997 | Exemplary | Medium | High | 0.1648 | 0.7755 | 2 | 1 | A | 2 | 100 | 95 | 95 | 430.00 | 383.53 | 0.926 | 475 | 26.2% | 10% | 16% | 13% | 40.0% | |
| 0P000004R4 | XNYS:SAP | SAP SE | Information Technology | Software - Application | USD | 100.80 | 2.24% | Annually | Narrow | Wide | 0.9948 | Poor | Medium | High | 0.1832 | 0.7124 | 2 | 3 | A | 3 | 85 | 60 | 80 | 141.00 | 120.06 | 0.772 | 141.83 | 40.7% | 13% | 22% | 18% | 30.0% | |
| 0P000004XO | XETR:SIE | Siemens AG | Industrials | Specialty Industrial Machinery | USD | 117.78 | 3.72% | Annually | Narrow | Narrow | 0.9875 | Exemplary | Medium | Medium | 0.1317 | 0.5590 | 2 | 3 | A | 3 | 80 | 25 | 75 | 145.00 | 137.37 | 0.834 | 175 | 48.6% | 16% | 25% | 21% | 40.0% | |
| 0P000004ZF | XNAS:SWKS | Skyworks Solutions Inc | Information Technology | Semiconductors | USD | 113.30 | 1.92% | Quarterly | Narrow | Narrow | 0.9769 | Exemplary | High | High | 0.2467 | 0.6325 | 3 | 3 | A | 3 | 70 | 65 | 55 | 210.00 | 184.50 | 0.574 | 165 | 45.6% | 18% | 30% | 24% | 70.0% | |
| 0P00000546 | XNAS:SBUX | Starbucks Corp | Consumer Discretionary | Restaurants | USD | 74.64 | 2.52% | Quarterly | Wide | Wide | 0.9994 | Exemplary | Medium | High | 0.2039 | 0.6300 | 1 | 2 | A++ | 3 | 45 | 70 | 85 | 106.00 | 98.70 | 0.729 | 105 | 40.7% | 11% | 17% | 14% | 40.0% | |
| 0P0000054E | XNYS:STT | State Street Corporation | Financials | Asset Management | USD | 66.97 | 3.33% | Quarterly | Wide | None | 0.1806 | Standard | High | High | 0.2723 | 0.8695 | 3 | 3 | A | 1 | 85 | 35 | 60 | 92.00 | 93.49 | 0.722 | 95 | 41.9% | 14% | 25% | 20% | 60.0% | |
| 0P0000059E | XNAS:TROW | T. Rowe Price Group Inc | Financials | Asset Management | USD | 123.04 | 3.61% | Quarterly | Wide | Wide | 0.9966 | Exemplary | Medium | High | 0.1927 | 0.7503 | 1 | 3 | A+ | 4 | 90 | 45 | 85 | 195.00 | 194.56 | 0.632 | 143 | 16.2% | 18% | 23% | 21% | 50.0% | |
| 0P000005AR | XNYS:TSM | Taiwan Semiconductor Manufacturing Co Ltd | Information Technology | Semiconductors | USD | 92.93 | 2.08% | Quarterly | Wide | Wide | 0.9993 | Exemplary | Medium | Very High | 0.5514 | 0.7971 | 1 | 3 | A++ | 2 | 80 | 95 | 75 | 171.00 | 130.47 | 0.617 | 150 | 61.4% | 10% | 18% | 14% | 75.0% | |
| 0P000002VU | XNYS:TT | Trane Technologies PLC | Industrials | Specialty Industrial Machinery | USD | 139.89 | 1.74% | Quarterly | Narrow | Wide | 0.9922 | Standard | High | High | 0.2216 | 0.6852 | 3 | – | A | – | – | – | 55 | 124.00 | 148.21 | 1.028 | 181 | 29.4% | 13% | 25% | 19% | 40.0% | |
| 0P000005M8 | XNYS:UL | Unilever PLC | Consumer Staples | Household & Personal Products | USD | 46.26 | 4.33% | Quarterly | Wide | Wide | 0.9998 | Standard | Low | High | 0.1587 | 0.6649 | 1 | 5 | A+ | 4 | 80 | 45 | 100 | 56.00 | 48.69 | 0.884 | 62 | 34.0% | 16% | 21% | 19% | 10.0% | |
| 0P000005P1 | XNYS:VFC | VF Corp | Consumer Discretionary | Apparel Manufacturing | USD | 52.00 | 3.81% | Quarterly | Narrow | Narrow | 0.9843 | Exemplary | Medium | High | 0.1584 | 0.6019 | 3 | 5 | A | 4 | 50 | 50 | 55 | 68.00 | 68.81 | 0.760 | 71 | 36.5% | 10% | 21% | 16% | 60.0% | |
| 0P000005V9 | XNYS:WAT | Waters Corp | Health Care | Diagnostics & Research | USD | 303.02 | — | Annually | Wide | Wide | 0.9984 | Exemplary | Medium | High | 0.1597 | 0.7003 | 2 | 4 | A | 2 | 95 | 90 | 90 | 250.00 | 263.99 | 1.179 | 340 | 12.2% | 14% | 25% | 20% | 20.0% | |
| 0P00018WBW | XNYS:YUMC | Yum China Holdings Inc | Consumer Discretionary | Restaurants | USD | 41.80 | 1.15% | Quarterly | Wide | Wide | 0.9963 | Standard | Medium | Very High | 0.3878 | 0.6904 | 3 | – | B++ | – | 65 | 90 | 60 | 86.00 | 69.27 | 0.538 | 60 | 43.5% | 16% | 28% | 22% | 50.0% |
8 Me gusta
Marcos, a ver si te animas a añadir esta lista de compra a la ECSS, a la que por cierto toca rebautizar con otras siglas que tengan más tirón comercial. Sería un formato más amigable.
Gracias.
Tomo nota. A partir del próximo mes añadiré una pestaña con cada mes que entre. Así también podremos ver en retrospectiva si han funcionado bien.
2 Me gusta
Veo que hay dos enlaces funcionando (New List CZD y Lista ECSS). Actualizas únicamente el primero ¿verdad?
Este es el bueno. Aparecen la estimación de dividendos futuros y de eps del Financial Times.
Pondré fecha de actualización para que no se pierda nadie.
7 Me gusta
Despedimos Mayo y el calorcito ya aprieta y como de costumbre le echamos un vistazo a la cuenta de Indexa de mi hijo. El objetivo para 2039 es de 218.569,10 EUR. Actualmente llevamos acumulado 6.873,22 EUR y la rentabilidad actual es del 7,8%. Ya se nota la corrección, estamos en rentabilidades más moderadas y sostenibles, aunque con la inflación esto no hay quien lo aguante. En fin, aún nos quedan 201 meses por delante y unos 212.000 euros para conseguir el objetivo. La aportación mensual debería ser de 481,57 EUR .
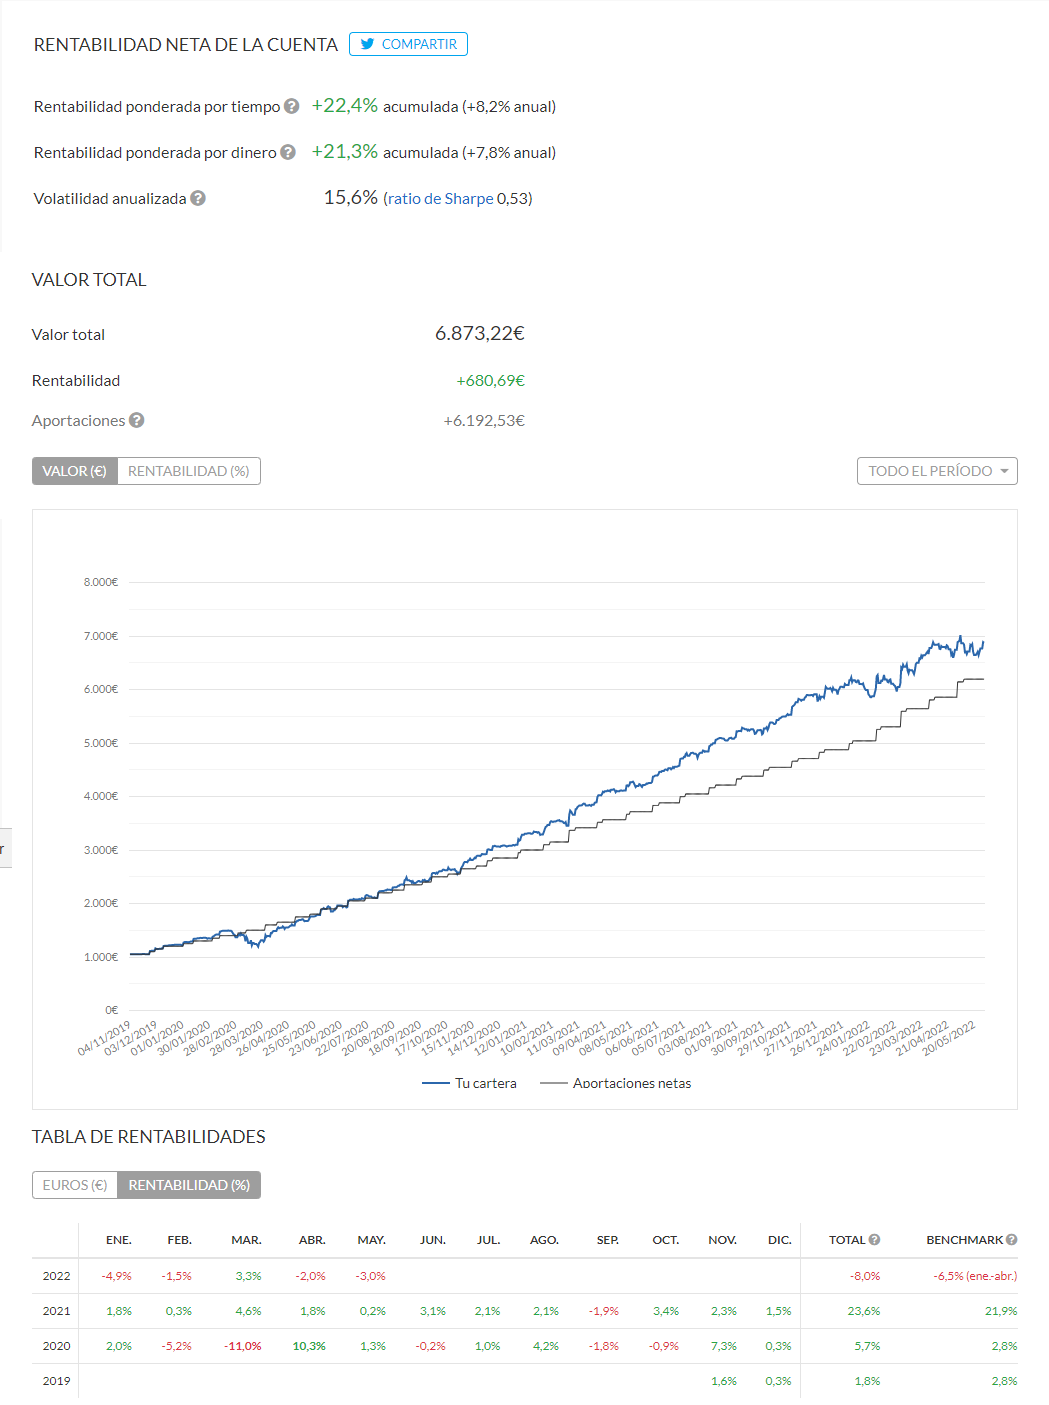
De momento no he comprado nada. A la espera de pillar algo bueno a buen precio. Sin prisa, intentando evitar errores. Quizá me quite del medio GILD, ya que no estoy contento con ella; fue un error y me precipité. ¿Cometeré un error vendiendo?
2 Me gusta
Si que ha cambiado la cosa en un mes ![]()
1 me gusta
No te “preocupa” que “donando” tales cantidades mensuales al mes, hacienda te pegue un toque Marcos?
Al margen de esto y como curiosidad también te pregunto: ¿a que es debido esa cantidad objetivo en concreto? Es decir, 200k por algo en particular? (es mera curiosidad)
Un saludo y gracias por lo que aportas.
De momento NO. Si algún día vienen por este tema procuraré hacer todo el ruido mediático posible, y lo pelearé en los tribunales si es preciso.
Es una cantidad razonable para gastar en sus estudios o formación, si es que decide estudiar. Ese dinero es para que tenga más opciones, si quiere irse a USA, a UK o a otro sitio. Aunque si es así seguramente se quede corta (pero paro eso están sus padres también).
Saludos
1 me gusta